# Connect Wio Terminal to Google Cloud IoT Core
## Introduction
In this tutorial, we will walk you through the process of connecting the Wio Terminal to Google Cloud IoT Core and send telemetry data from the Wio Terminal to the Google Cloud IoT core. This will be divided into two sections where the first section will talk about how to use the exciting libraries to send telemetry data preconfigured in the code, whereas the second section will talk about how to add your own sensors to the Wio Terminal to send the telemetry data to Google Cloud IoT Core. Google Cloud IoT Core supports both HTTP and MQTT protocols for communication, but however we will be using the MQTT protocol in this tutorial.
### What is Google Cloud?
[Google Cloud](https://cloud.google.com/) consists of a set of physical assets, such as computers and hard disk drives, and virtual resources, such as virtual machines (VMs), that are contained in Google's data centers around the globe. This distribution of resources provides several benefits, including redundancy in case of failure and reduced latency by locating resources closer to clients.
In cloud computing, what you might be used to thinking of as software and hardware products, become services. These services provide access to the underlying resources. The [list of available Google Cloud services](https://cloud.google.com/products) is long, and it keeps growing. When you develop your website or application on Google Cloud, you mix and match these services into combinations that provide the infrastructure you need, and then add your code to enable the scenarios you want to build.
### What is Google Cloud Platform?
[Google Cloud Platform (GCP)](https://console.cloud.google.com/) is a collection of cloud computing services. With a set of management tools, it provides a series of modular cloud services including computing, data storage, data analytics and machine learning. It provides infrastructure as a service, platform as a service, and serverless computing environments.
### What is Google Cloud IoT Core?
[Google Cloud Internet of Things (IoT) Core](https://cloud.google.com/iot/docs) is a fully managed service for securely connecting and managing IoT devices, from a few to millions. Ingest data from connected devices and build rich applications that integrate with the other big data services of Google Cloud Platform.
### What is Google Cloud Console?
[Google Cloud Console](https://console.cloud.google.com/) provides a web-based, graphical user interface that you can use to manage Google Cloud Platform resources. When you use the Cloud Console, you create a new project, or choose an existing project, and use the resources that you create in the context of that project. You can create multiple projects, so you can use projects to separate your work in whatever way makes sense for you. For example, you might start a new project if you want to make sure only certain team members can access the resources in that project, while all team members can continue to access resources in another project.
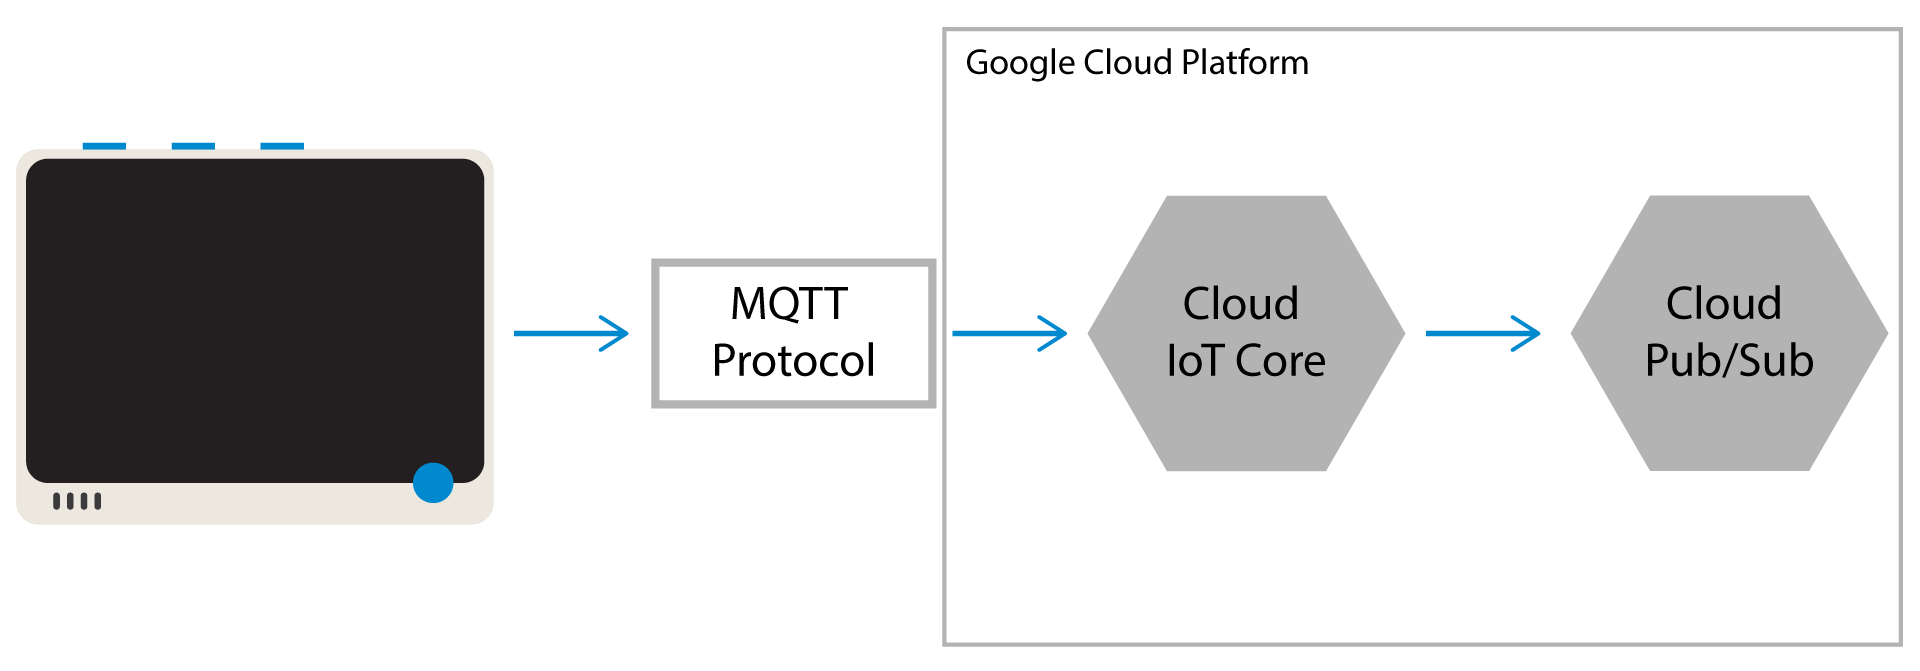
## Connecting Wio Terminal to Google Cloud IoT Core via MQTT
As explained before, we will be using the availble MQTT bridge for the communication between the Wio Terminal and the Google Cloud IoT Core. However, you may use the HTTP bridge as well, if that is your requirement.
### Google Cloud Console Set Up
First we need to visit the Google Cloud Console, create a Cloud IoT Core device registry and register a device.
#### Intial Setup
- **STEP 1:** Visit [here](https://console.cloud.google.com/) to create a new project
**Note:** Log in to your Google account if prompted
- **STEP 2:** Click **Select a project** menu
- **STEP 3:** Click **NEW PROJECT** and enter a **project name**
- **STEP 4:** Click **CREATE**
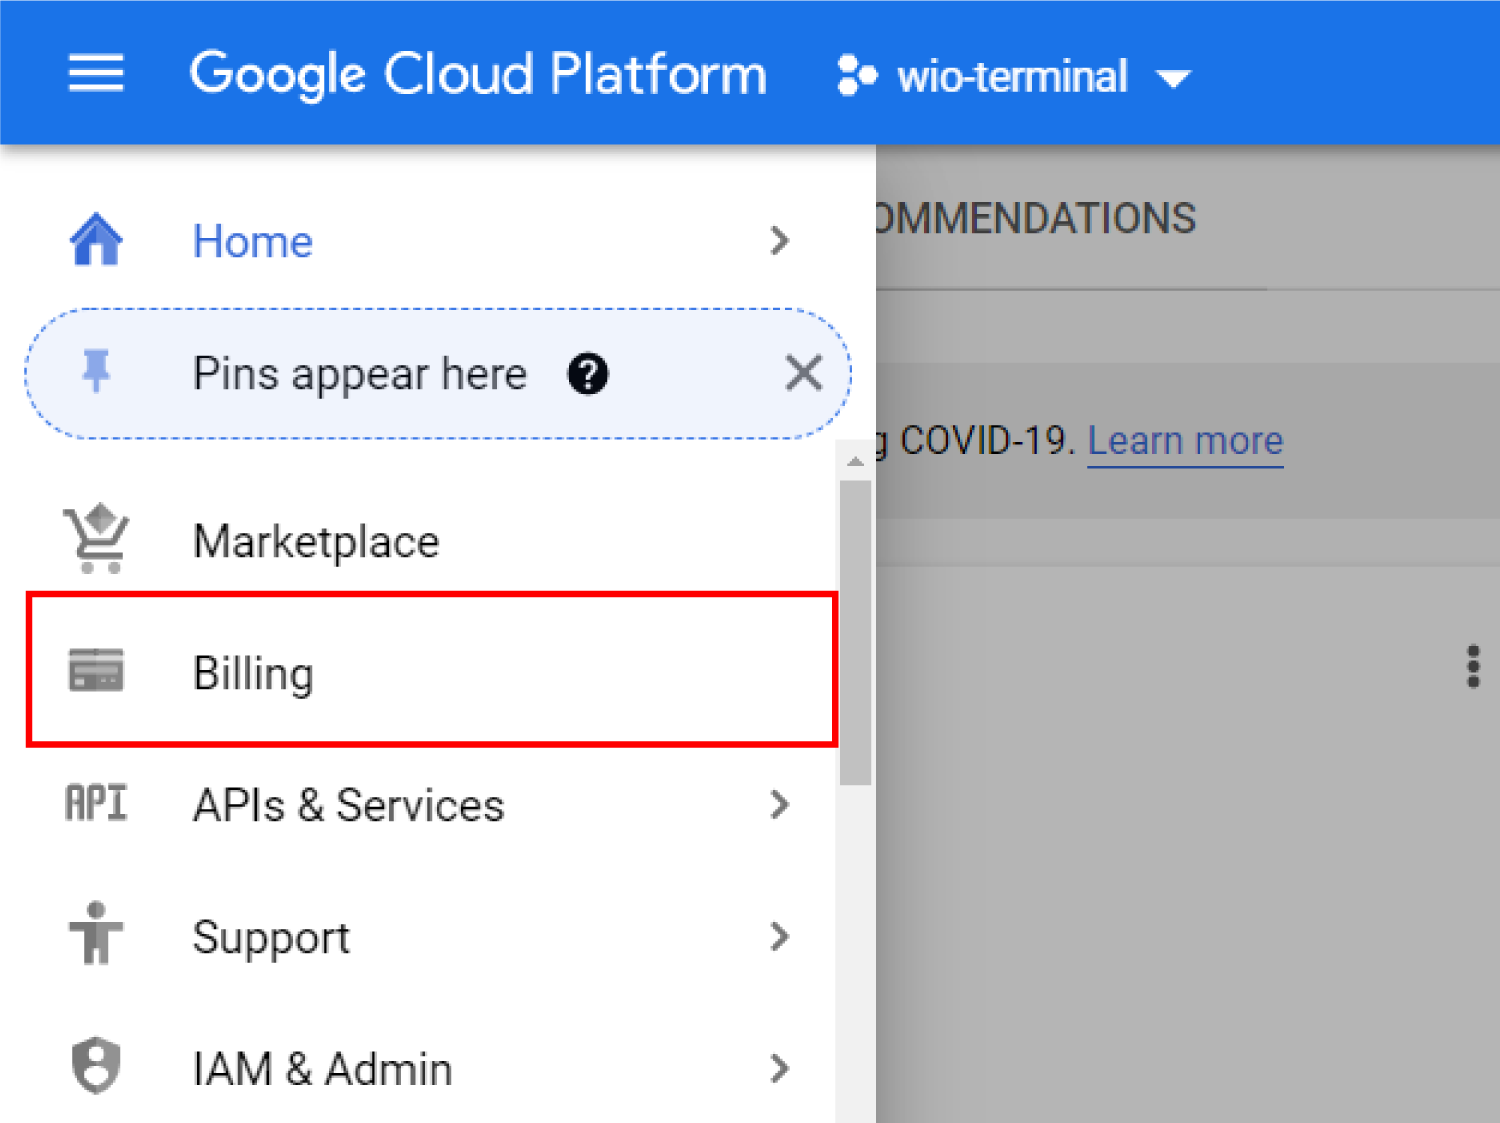
- **STEP 5:** Enable billing for your Cloud project. This is required to make sure you are not a robot and you will not be charged. Choose "Billing" under the navigation menu and go through the set up.
- **STEP 6:** Visit [here](https://console.cloud.google.com/flows/enableapi?apiid=cloudiot.googleapis.com%2Cpubsub&authuser=3&_ga=2.254170561.853675115.1607885458-878786893.1606048800) to enable the Cloud IoT Core and Cloud Pub/Sub APIs
**Note:** Choose the project that you created before from the drop-down menu
#### Create a Device Registry
- **STEP 1:** Visit [Google Cloud IoT Core page](https://console.cloud.google.com/iot/registries) in Cloud Console
- **STEP 2:** Click **Create Registry**
- **STEP 3:** Enter a **registry ID**
**Note:** This is the name of your registry
- **STEP 4:** Select a **Region**
**Note:** If you're in the US, select us-central1 for the Region. If you're outside the US, select your preferred region.
- **STEP 5:** In the **Select a Cloud Pub/Sub topic** dropdown list, select **Create a topic** and type your preferred **Topic ID**
- **STEP 6:** Click **CREATE TOPIC**
- **STEP 7:** Click on **SHOW ADVANCED OPTIONS**
- **STEP 8:** The **Device state topic** and **Certificate value** fields are optional, so leave them blank
- **STEP 9:** Select **MQTT** for the **Protocol**
- **STEP 10:** Click **Create** on the Cloud IoT Core page
Now we have created a device registry with a Cloud Pub/Sub topic for publishing device telemetry events
#### Generate a Device Key Pair (EC Keys)
Cloud IoT Core uses public key (or asymmetric) authentication
- The device uses a private key to sign a [JSON Web Token (JWT)](https://cloud.google.com/iot/docs/how-tos/credentials/jwts). The token is passed to Cloud IoT Core as proof of the device's identity.
- The service uses the device public key (uploaded before the JWT is sent) to verify the device's identity.
Cloud IoT Core supports the RSA and Elliptic Curve algorithms, and we will be using Elliptic Curve keys in this tutorial.
- **STEP 1:** Create a new folder on your PC
- **STEP 2:** Navigate to the folder from a terminal window and type the following to generate a P-256 Elliptic Curve key pair
```sh
openssl ecparam -genkey -name prime256v1 -noout -out ec_private.pem
openssl ec -in ec_private.pem -pubout -out ec_public.pem
```
**Note:** Make sure to install **openssl** by following [this link](https://slproweb.com/products/Win32OpenSSL.html) and adding the directory location to PATH.
The above commands create the following public/private key pair:
- **ec_private.pem**: The private key that must be securely stored on the device and used to sign the authentication JWT.
- **ec_public.pem**: The public key that must be stored in Cloud IoT Core and used to verify the signature of the authentication JWT.
#### Extract the Private Key
We need to extract the private key bytes and copy them into the private key string in the Arduino project that we will create later in this tutorial. Save these keys for now to use later.
- **STEP 1:** Open a terminal window and navigate to the folder containing the Elliptic Curve key pair that we generated before.
- **STEP 2:** Type the following command
```sh
openssl ec -in ec_private.pem -noout -text
```
- **STEP 3:** Copy and paste the generated private key bytes under **priv:** into a notepad and save for later use.
#### Add a Device to the Registry
- **STEP 1:** Visit the [Registries page](https://console.cloud.google.com/iot/registries) and select the registry that you created before
- **STEP 2:** Select the **Devices** tab and click **CREATE A DEVICE**
- **STEP 3:** Enter a **Device ID**
- **STEP 4:** The **Device metadata** field is optional, so leave it blank
- **STEP 5:** Click on the **COMMUNICATION, CLOUD LOGGING, AUTHENTICATION** drop-down menu
- **STEP 6:** Select **Allow** for **Device communication**
- **STEP 7:** Inside the **Authentication** field, under **Input method**, select **Upload**
- **STEP 8:** Select **ES256** from the **Public key format** drop-down menu
- **STEP 9:** Under **Public key value**, press the **BROWSE** button ,navigate to the **Elliptic Curve key pair** folder that we created before and select **ec_public.pem**
- **STEP 10:** Click **Create**
You have now added a device to your registry. The ES256 key appears on the Device details page for your device.
#### Set up a Subscriber
Now that we have created a device registry, created a topic and added a device to that registry, let's move on to creating a subscriber to subcribe to the topic we have created, in order to grab the telemetry data from the Wio Terminal.
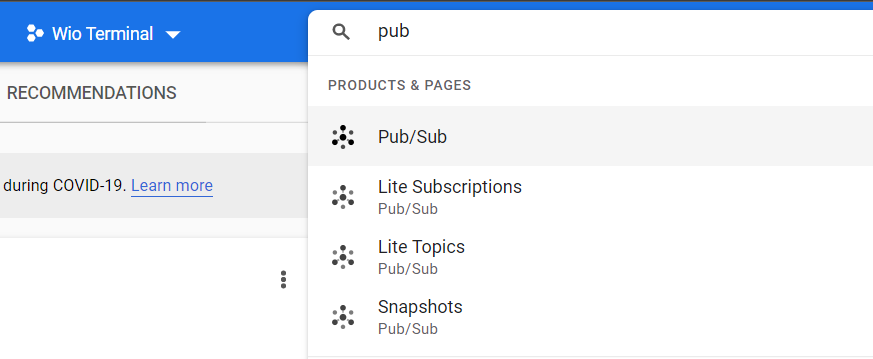
- **STEP 1:** Type **Pub** on the search bar of Google Cloud Console and select **Pub/Sub** from the results
- **STEP 2:** Click **Subscriptions** on the navigation menu
- **STEP 3:** Click **CREATE SUBSCRIPTION**
- **STEP 4:** Enter a **Subscription ID** of your choice
- **STEP 5:** Select the **Pub/Sub topic** that we previously created from the **Select a Cloud Pub/Sub topic** drop-down menu
- **STEP 6:** Select **Pull** as the Delivery type
- **STEP 7:** Click **Create**
Now we have finished setting up the Google Cloud IoT Core. Next, we will move on to setting up the Wio Terminal along with the Arduino IDE.
### Arduino Set Up with Wio Terminal
#### Needed Libraries
We need two libraries for this tutorial.
1. lwMQTT MQTT Arduino Library
2. Google Cloud IoT Arduino Library
To download these libaries:
- **STEP 1:** Open Arduino IDE
- **STEP 2:** Navigate to `Sketch > Include Library > Manage Libraries`
- **STEP 3:** Type **lwMQTT** and **Google Cloud IoT** in the search box and install the libraries
#### Credentials and Account Information Configuration
Now we need to set the Wi-Fi credentials and Google Cloud IoT Core information in the **ciotc_config.h** file.
- **STEP 1:** Inside Arduino IDE, `File > Examples > Google Cloud IoT JWT > Esp32-lwmqtt`
- **STEP 2:** Navigate to **ciotc_config.h**
- **STEP 3:** Change the **Wifi network details**
```c++
const char *ssid = "Enter_SSID";
const char *password = "Enter_Password";
```
- **STEP 4:** Change the **Google Cloud IoT details**
```c++
const char *project_id = "Enter_Project_ID";
const char *location = "Enter_location";
const char *registry_id = "Enter_Registry_ID";
const char *device_id = "Enter_Device_ID";
```
- **STEP 5:** Copy the private key bytes that we obtained from **ec_private.pem** and saved into notepad before
```c++
const char *private_key_str =
"6e:b8:17:35:c7:fc:6b:d7:a9:cb:cb:49:7f:a0:67:"
"63:38:b0:90:57:57:e0:c0:9a:e8:6f:06:0c:d9:ee:"
"31:41";
```
**Note:** The key length should be 32 pairs of hex digits
#### Change NTP Time Methods
Open **esp32-mqtt.h** and replace the entire file with the following codes. Here we have replaced configTime function with the implementation of obtaining NTP time via UDP.
```c++
#include
#include
#include
#include
#include
#include
#include "ciotc_config.h" // Update this file with your configuration
// !!REPLACEME!!
// The MQTT callback function for commands and configuration updates
// Place your message handler code here.
void messageReceived(String &topic, String &payload){
Serial.println("incoming: " + topic + " - " + payload);
}
///////////////////////////////
// Initialize WiFi and MQTT for this board
//Client *netClient;
CloudIoTCoreDevice *device;
CloudIoTCoreMqtt *mqtt;
MQTTClient *mqttClient;
unsigned long iat = 0;
String jwt;
WiFiUDP udp;
unsigned int localPort = 2390;
unsigned long devicetime;
const int NTP_PACKET_SIZE = 48; // NTP time stamp is in the first 48 bytes of the message
byte packetBuffer[NTP_PACKET_SIZE]; //buffer to hold incoming and outgoing packets
// send an NTP request to the time server at the given address
unsigned long sendNTPpacket(const char* address) {
// set all bytes in the buffer to 0
for (int i = 0; i < NTP_PACKET_SIZE; ++i) {
packetBuffer[i] = 0;
}
// Initialize values needed to form NTP request
// (see URL above for details on the packets)
packetBuffer[0] = 0b11100011; // LI, Version, Mode
packetBuffer[1] = 0; // Stratum, or type of clock
packetBuffer[2] = 6; // Polling Interval
packetBuffer[3] = 0xEC; // Peer Clock Precision
// 8 bytes of zero for Root Delay & Root Dispersion
packetBuffer[12] = 49;
packetBuffer[13] = 0x4E;
packetBuffer[14] = 49;
packetBuffer[15] = 52;
// all NTP fields have been given values, now
// you can send a packet requesting a timestamp:
udp.beginPacket(address, 123); //NTP requests are to port 123
udp.write(packetBuffer, NTP_PACKET_SIZE);
udp.endPacket();
}
unsigned long getNTPtime() {
// module returns a unsigned long time valus as secs since Jan 1, 1970
// unix time or 0 if a problem encounted
//only send data when connected
if (WiFi.status() == WL_CONNECTED) {
//initializes the UDP state
//This initializes the transfer buffer
udp.begin(WiFi.localIP(), localPort);
sendNTPpacket(ntp_primary); // send an NTP packet to a time server
// wait to see if a reply is available
delay(1000);
if (udp.parsePacket()) {
// Serial.println("udp packet received");
// Serial.println("");
// We've received a packet, read the data from it
udp.read(packetBuffer, NTP_PACKET_SIZE); // read the packet into the buffer
//the timestamp starts at byte 40 of the received packet and is four bytes,
// or two words, long. First, extract the two words:
unsigned long highWord = word(packetBuffer[40], packetBuffer[41]);
unsigned long lowWord = word(packetBuffer[42], packetBuffer[43]);
// combine the four bytes (two words) into a long integer
// this is NTP time (seconds since Jan 1 1900):
unsigned long secsSince1900 = highWord << 16 | lowWord;
// Unix time starts on Jan 1 1970. In seconds, that's 2208988800:
const unsigned long seventyYears = 2208988800UL;
// subtract seventy years:
unsigned long epoch = secsSince1900 - seventyYears;
// adjust time for timezone offset in secs +/- from UTC
// WA time offset from UTC is +8 hours (28,800 secs)
// + East of GMT
// - West of GMT
// long tzOffset = 28800UL;
long tzOffset = 0UL;
// WA local time
unsigned long adjustedTime;
return adjustedTime = epoch + tzOffset;
}
else {
// were not able to parse the udp packet successfully
// clear down the udp connection
udp.stop();
return 0; // zero indicates a failure
}
// not calling ntp time frequently, stop releases resources
udp.stop();
}
else {
// network not connected
return 0;
}
}
///////////////////////////////
// Helpers specific to this board
///////////////////////////////
String getDefaultSensor(){
return "Wifi: " + String(WiFi.RSSI()) + "db";
}
String getJwt(){
Serial.println("Refreshing JWT");
iat = getNTPtime();
Serial.println(iat);
jwt = device->createJWT(iat, jwt_exp_secs);
Serial.println(jwt);
return jwt;
}
void setupWifi(){
Serial.println("Starting wifi");
WiFi.mode(WIFI_STA);
// WiFi.setSleep(false); // May help with disconnect? Seems to have been removed from WiFi
WiFi.begin(ssid, password);
Serial.println("Connecting to WiFi");
while (WiFi.status() != WL_CONNECTED){
delay(100);
}
// configTime(0, 0, ntp_primary, ntp_secondary);
Serial.println("Waiting on time sync...");
// Serial.println(getNTPtime());
while (getNTPtime() < 1510644967){
delay(10);
}
}
void connectWifi(){
Serial.print("checking wifi...");
while (WiFi.status() != WL_CONNECTED){
Serial.print(".");
delay(1000);
}
}
///////////////////////////////
// Orchestrates various methods from preceeding code.
///////////////////////////////
bool publishTelemetry(String data){
return mqtt->publishTelemetry(data);
}
bool publishTelemetry(const char *data, int length){
return mqtt->publishTelemetry(data, length);
}
bool publishTelemetry(String subfolder, String data){
return mqtt->publishTelemetry(subfolder, data);
}
bool publishTelemetry(String subfolder, const char *data, int length){
return mqtt->publishTelemetry(subfolder, data, length);
}
void connect(){
connectWifi();
mqtt->mqttConnect();
}
WiFiClientSecure netClient;
void setupCloudIoT(){
device = new CloudIoTCoreDevice(
project_id, location, registry_id, device_id,
private_key_str);
setupWifi();
// netClient = new WiFiClientSecure();
mqttClient = new MQTTClient(512);
mqttClient->setOptions(180, true, 1000); // keepAlive, cleanSession, timeout
mqtt = new CloudIoTCoreMqtt(mqttClient, &netClient, device);
mqtt->setUseLts(true);
mqtt->startMQTT();
}
```
#### Add Macro Definition to Esp32-lwmqtt.ino
Add Wio Terminal board to macro definitions inside **Esp32-lwmqtt.ino**
```c++
#if defined(ESP32) || defined(WIO_TERMINAL)
#define __ESP32_MQTT_H__
#endif
```
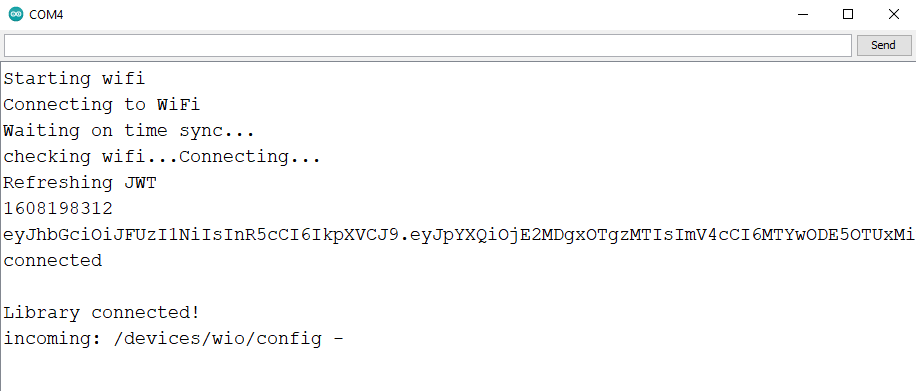
Now we have finished setting up Arduino IDE. Finally you need to Upload this code to Wio Terminal. Open Serial Monitor and you will see the following displayed.
### Display Telemetry Data
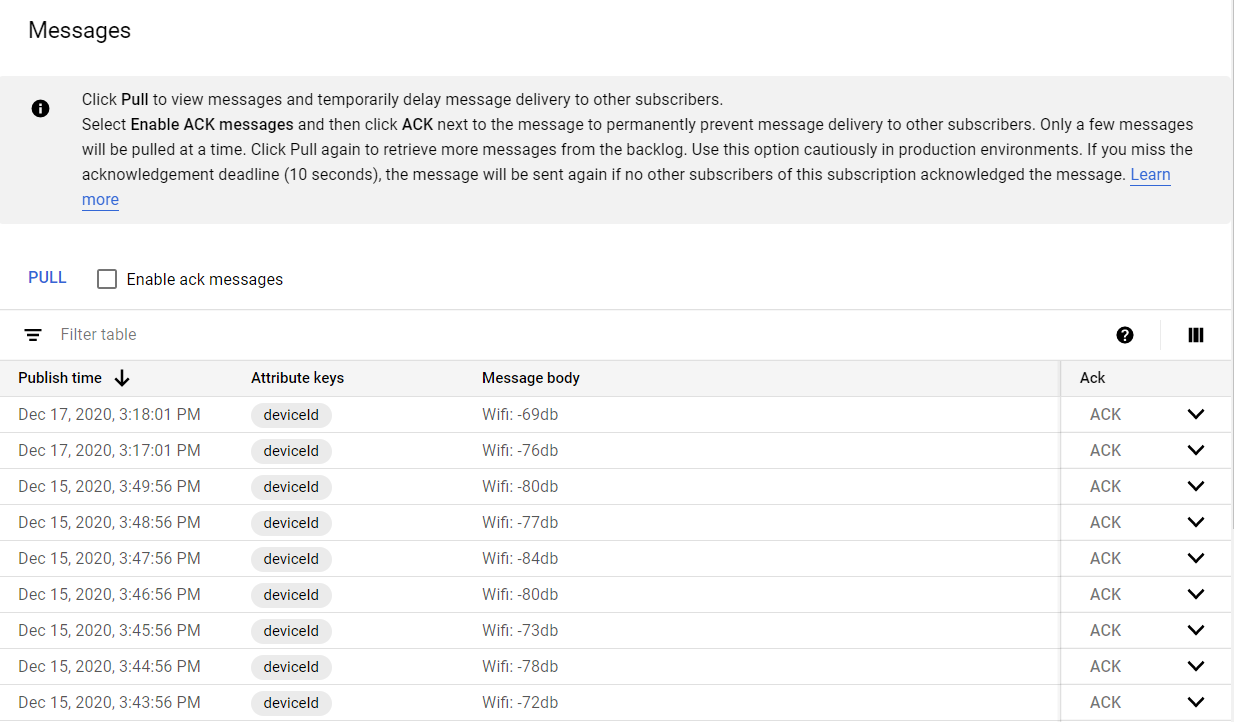
Now we need to display the incoming telemetry data from the Wio Terminal. Here in this example code, the Wi-Fi signal strength will be sent as telemetry data.
- **STEP 1:** Visit **Pub/Sub** in Google Cloud Console
**Note:** You can search **Pub** in the search bar within Google Cloud Console
- **STEP 2:** Navigate to **Subscriptions** inside Navigation Menu
- **STEP 3:** Select the subscription ID that we created before
- **STEP 4:** Click on **VIEW MESSAGES**
- **STEP 5:** Click on **PULL** and you will see the incoming telemetry data as follows.
### How to Add Other Sensors?
You can add any sensor to the Wio Terminal and send telemetry data to Google Cloud IoT Core. For simplicity, we will use the built-in light sensor on the Wio Terminal to send light intensity levels to Google Cloud IoT Core.
#### Google Cloud IoT Set Up
- **STEP 1:** Visit **IoT Core** in Google Cloud Console
**Note:** You can search **IoT Core** in the search bar within Google Cloud Console
- **STEP 2:** Select the registry that we created before
- **STEP 3:** Under Cloud **Pub/Sub topics** select **Add or edit topics**
- **STEP 4:** Click **ADD ADDITIONAL TOPIC**
- **STEP 5:** Click **CREATE A TOPIC** from the drop-down menu of **Select a Cloud Pub/Sub topic**
- **STEP 6:** Enter a **Topic ID** and click **CREATE TOPIC**
- **STEP 7:** Enter a **Subfolder name** inside the **Subfolder** column
**Note:** Subfolder name will be used to relate to the topic in the Arduino code
- **STEP 8:** Click **UPDATE**
- **STEP 9:** Create a **new subscription** as explained before
#### Arduino Set Up
Navigate to **Esp32-lwmqtt.ino** and add the following
- **STEP 1:** After the loop, add the following for the built-in light sensor
```c++
void loop() {
int light = analogRead(WIO_LIGHT); //assign variable to store light sensor values
light = map(light,0,1023,0,100); //Map sensor values
```
- **STEP 2:** Add the topic with the Subfolder name
```c++
publishTelemetry(getDefaultSensor());
publishTelemetry("/light",String(light));
```
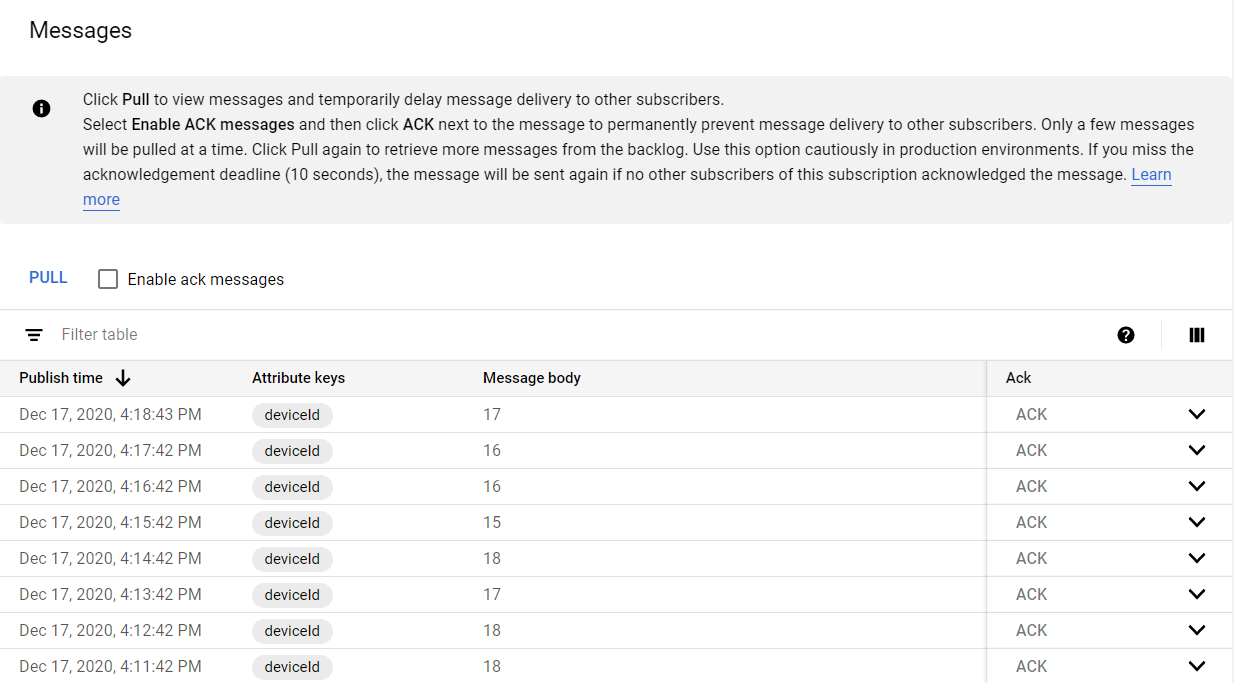
**Note:** If a subfolder name is not added, telemetry data will be sent to the default topic. In this case, the telemetry data for Wi-Fi signal strength as explained before will be sent to the first topic that we crated before which is the default topic.
After you upload the code to the Wio Terminal, pull from the newly created topic as a subscriber and you will see the following result.
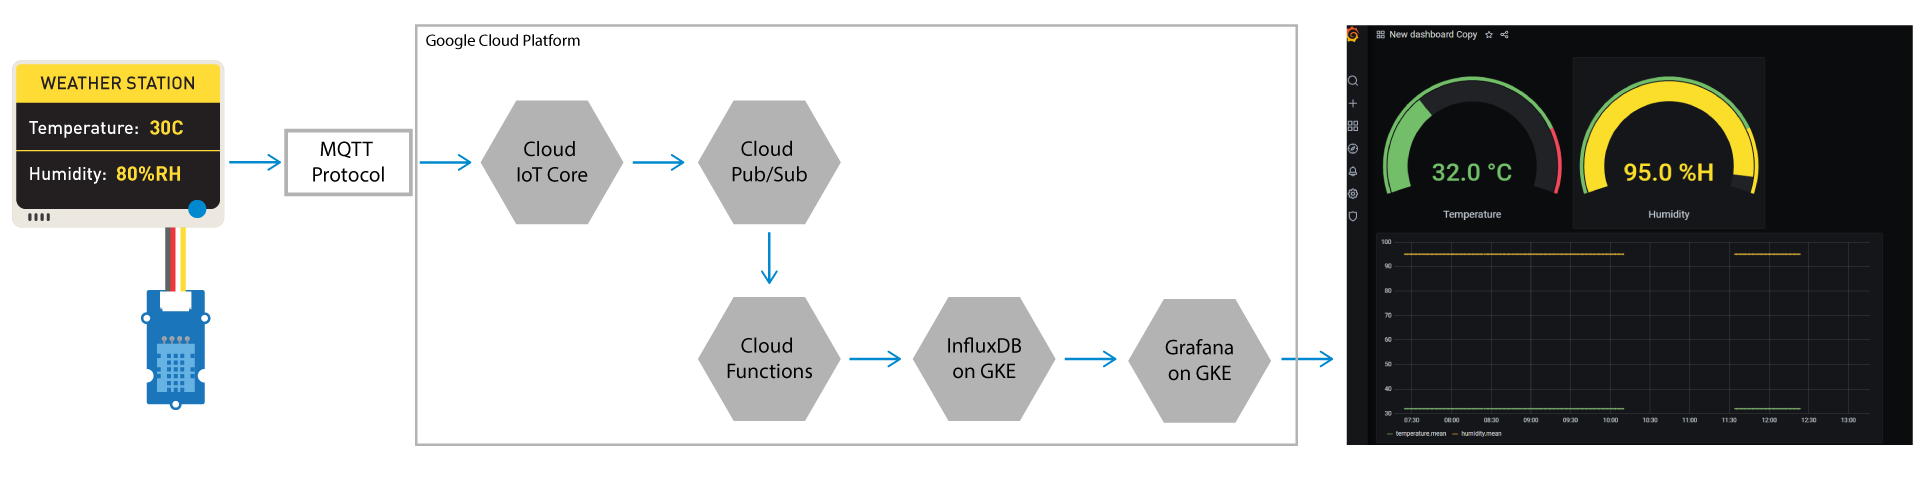
### How to Add Other Sensors And Visualize Data on Dashboards?
Eventhough Google Cloud IoT Core doesn't offer a ready-to-use dashboard to visualize the data from sensors, we will explain how to achieve this by using InfluxDB and Grafana.
[InfluxDB](https://www.influxdata.com/) is a time series database,that is each data in InfluxDB is associated with a particular timestamp which shows date and time associated with a particular data. Whereas [Grafana](https://grafana.com/) is an open source solution for running data analytics, pulling up metrics that make sense of the massive amount of data and to monitor apps with the help of customizable dashboards.
Basically, we will connect a temperature/ humidity sensor to the Wio Terminal, use a Google Cloud Function to transmit data from a Pub/Sub to a InfluxDB located in a GKE (Google Kubernetes Engine) cluster and display the data from InfluxDB on Grafana using interactive dashboards.

#### Hardware Set Up for Arduino
Connect the Grove - Temperature and Humudity Sensor (DHT11) to the Grove - Digital/Analog Port (D0) of the Wio Terminal.
#### Software Set Up for Arduino
- **STEP 1:** Visit the [Grove - Temperature and Humidity Sensor repo](https://github.com/Seeed-Studio/Grove_Temperature_And_Humidity_Sensor) and download it as a zip file
- **STEP 2:** Open Arduino, navigate to `Sketch > Include Library > Add .ZIP Library` and select the downloaded library to install it
Navigate to the previously used **Esp32-lwmqtt.ino** and add the following:
- **STEP 1:** Add the following after **#include "esp32-mqtt.h"**
```c++
#include "DHT.h" //DHT library
#define DHTPIN 0 //Define Signal Pin of DHT
#define DHTTYPE DHT11 //Define DHT Sensor Type
DHT dht(DHTPIN, DHTTYPE); //Initializing DHT sensor
```
- **STEP 2:** Add the following inside the **setup** to start the DHT sensor
```c++
dht.begin();
```
- **STEP 3:** Add the following inside the **if loop** within **void loop()**
```c++
int temperature = dht.readTemperature(); //Assign variable to store temperature
int humidity = dht.readHumidity(); //Assign variable to store humidity
String payload = String("{\"timestamp\":") + getNTPtime() +
String(",\"temperature\":") temperature +
String(",\"humidity\":") + humidity +
String("}");
publishTelemetry(payload);
```
**Note:** Here we parse all the data as a string into influxDB. Parsing the **time** is important because influxDB is a time series database. Also the **pushTelemetry** function will send the data to the default topic we have created at the very beginning of this tutorial.
- **STEP 4:** Upload the code to the Wio Terminal
#### Google Cloud IoT Set Up
- **STEP 1:** Visit [this](https://github.com/lakshanthad/esp32-cloud-iot-core-k8s) repo and download it as a zip file
- **STEP 2:** Extract the downloaded zip file
- **STEP 3:** Open Google Cloud Console and navigate to [Google Kubernetes Engine](https://console.cloud.google.com/kubernetes/list) and wait for the system to initialize
- **STEP 4:** Start the Cloud shell by pressing the button on the top right corner
- **STEP 5:** Type the following commands to set defaults for the gcloud command-line tool
```sh
export ZONE= # e.g. us-central1-a, see https://cloud.google.com/compute/docs/regions-zones/#available
export PROJECT_ID= # project ID name
gcloud config set project $PROJECT_ID
gcloud config set compute/zone $ZONE
```
- **STEP 6:** Type the following commands to create a GKE cluster with one n1-standard-1 node
```sh
gcloud container clusters create influxdb-grafana \
--num-nodes 1 \
--machine-type n1-standard-1 \
--zone $ZONE
```
- **STEP 7:** Type the following commands to create a secret to store InfluxDB and Grafana auth information
```sh
kubectl create secret generic influxdb-grafana \
--from-literal=influxdb-user=admin \
--from-literal=influxdb-password=passw0rd \
--from-literal=grafana-user=admin \
--from-literal=grafana-password=passw0rd
```
**Note:** You can change influxdb/ grafana usernames and passwords according to your preference
- **STEP 8:** Click on **Open Editor** within Google Shell
- **STEP 9:** Drag and drop the previously downloaded and extracted folder into **Cloud Shell Editor**
- **STEP 10:** Click on **Open Terminal** to go back to terminal. Navigate to **05-influxdb_grafana_k8s** directory by typing the following
```sh
cd esp32-cloud-iot-core-k8s-master/05-influxdb_grafana_k8s
```
- **STEP 11:** Type the following commands to deploy InfluxDB and Grafana to Kubernetes
```sh
kubectl create -f k8s/
```
#### Grafana Setup
- **STEP 1:** Type the following to check the services external IPs / ports
```sh
kubectl get services
```
- **STEP 2:** Copy the external IP of Grafana
- **STEP 3:** Visit `http://:3000`
**Note:** Paste the previously copied Grafana external IP to ``
- **STEP 4:** Log in to Grafana with the previously set credentials
- **STEP 5:** Click on the gear icon and navigate to `Configuration > Data Sources`
- **STEP 6:** Click **Add data source** and select **influxDB**
- **STEP 7:** Enter the following into the **URL** field
```sh
http://influxdb:8086
```
- **STEP 8:** Enter the following in the **Database** field and click **Save & Test**
```sh
iot
```
**Note:** You should see the message **Data source is working**, if you have sucessfully set up **InfluxDB** data source on Grafana
#### Create a Google Cloud Function
Now we need to create a Google Cloud Function to transmit data from a topic on Pub/Sub to InfluxDB and display the data from InfluxDB on Grafana using interactive dashboards.
- **STEP 1:** Go back to **Google Cloud Console** and open the **Cloud Shell**
- **STEP 2:** Type the following to enable **Cloud Functions API**
```sh
gcloud services enable cloudfunctions.googleapis.com
```
- **STEP 3:** Navigate to **06-cloud_function** directory by typing the following
```sh
cd esp32-cloud-iot-core-k8s-master/06-cloud_function
```
- **STEP 4:** Open **main.py** in a **vim text editor**
```sh
cd esp32-cloud-iot-core-k8s-master/06-cloud_function
```
- **STEP 5:** Press **i** on the keyboard to enter **editing mode**
- **STEP 6:** modify **InfluxDB variables** (host, port, username, password) in the **_get_influxdb_client function**
**Note:** Obtain the InfluxDB host by typing the following on Cloud Shell and copying the external IP
```sh
kubectl get services
```
- **STEP 7:** Save the file by typing **:wq**
- **STEP 8:** Deploy the **Cloud Function** by typing the following
```sh
export PUBSUB_TOPIC="enter_topic-name>"
export REGION="enter_region" # https://cloud.google.com/functions/docs/locations
gcloud functions deploy iotcore_pubsub_to_influxdb --runtime python37 --trigger-topic $PUBSUB_TOPIC --region $REGION
```
#### Back to Grafana Setup
- **STEP 1:** Open Grafana and navigate to `Dashboards > Manage`
- **STEP 2:** Click **New Dashboard** and click **Add new panel**
- **STEP 3:** Navigate to **Visualization** and click **Graph**
- **STEP 4:** Under **Query**, in the **FROM** tab, click **select measurement** and select **temperature** from the drop-down menu
- **STEP 5:** Click **+ Query** and repeat the same step as **step 12** for **humidity**
- **STEP 6:** Change the other settings according to your preference
- **STEP 7:** Click **Apply**
- **STEP 8:** Click **Add panel** and **Add new panel**
- **STEP 9:** Navigate to **Visualization** and click **Gauge**
- **STEP 10:** Under **Query**, in the **FROM** tab, click **select measurement** and select **temperature** from the drop-down menu
- **STEP 11:** In **Field** tab, under **Unit**, select `Temperature > Celcius` from the drop-down menu
- **STEP 12:** Set a minimum and maximum value for the gauge by typing in **Min** and **Max**
- **STEP 13:** Under **Display name**, type `Temperature`
- **STEP 14:** Repeat the same for **humidity** by following from **step 15**.
- **STEP 15:** Click **Apply**
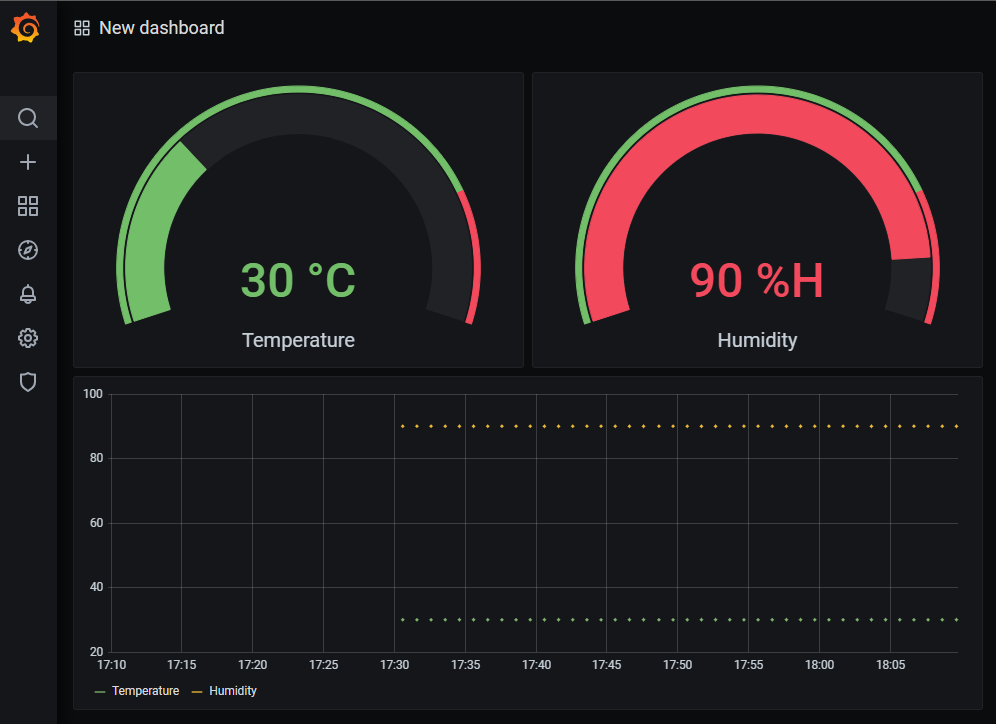
You will now see the dashboard created on Grafana
## Tech Support
Please submit any technical issue into our [forum](https://forum.seeedstudio.com/)