# Microsoft Azure IoT Data visualisation with Power BI
**SenseCAP K1100 - The Sensor Prototype Kit** represents Seeed Studio concentrating the essence of LoRa® communication on technology and edge intelligence products, for the easiest deploying and mastering of LoRa® and IoT applications.

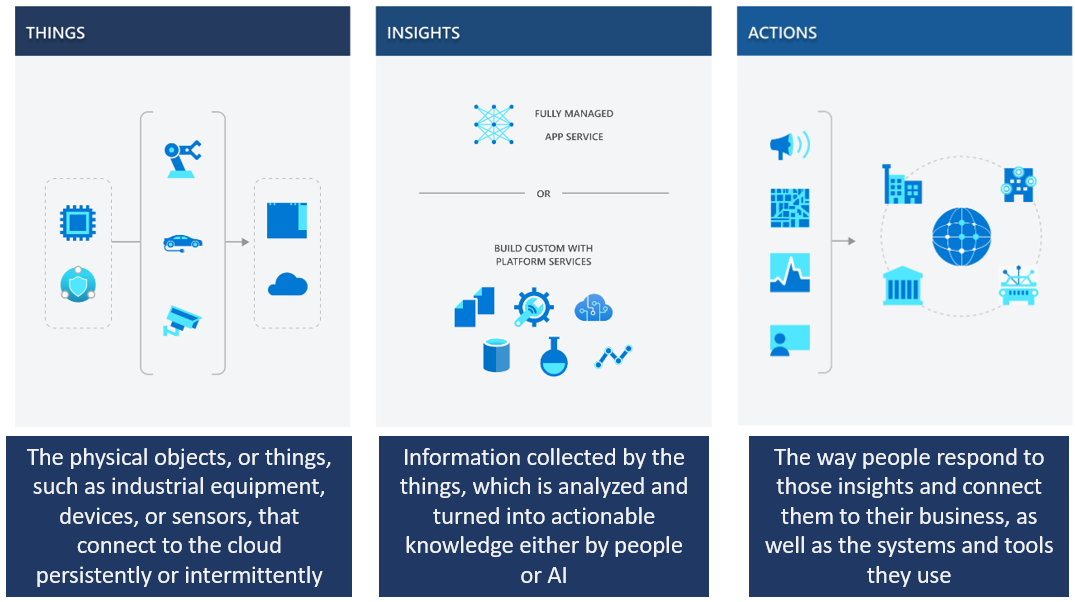
## Microsoft Azure IoT
[Microsoft Azure IoT](https://azure.microsoft.com/en-us/overview/iot) is a collection of Microsoft-managed cloud services that connect, monitor, and control billions of IoT assets. It includes security and operating systems for devices and equipment, along with data and analytics that help businesses to build, deploy and manage IoT applications.
## Power BI
Connect and analyze your entire data estate by combining Power BI with Azure analytics services—including Azure Synapse Analytics and Azure Data Lake Storage. Analyze petabytes of data, use advanced AI capabilities, apply additional data protection, and more easily share insights across your organization.
Turn your data into a competitive advantage by using Power BI and Azure together to connect, combine, and analyze your entire data estate.
In this tutorial, you configure your IoT Central application to export telemetry collected from the devices. You then use Power BI to create a custom dashboard for the store manager to visualize the insights derived from the telemetry.
In this tutorial, you configure your IoT Central application to export telemetry collected from the devices. You then use Power BI to create a custom dashboard for the store manager to visualize the insights derived from the telemetry.
In this tutorial, you learn how to:
- Configure an IoT Central application to export telemetry to an event hub.
- Use Logic Apps to send data from an event hub to a Power BI streaming dataset.
- Create a Power BI dashboard to visualize data in the streaming dataset.
## Preliminary preparation
To complete this tutorial, you need:
- An Azure subscription. If you don't have an Azure subscription, create a [free account](https://azure.microsoft.com/free/?WT.mc_id=A261C142F) before you begin.
- A Power BI account. If you don't have a Power BI account, sign up for a [free Power BI Pro trial](https://app.powerbi.com/signupredirect?pbi_source=web) before you begin.
- In any of the following wikis, you have successfully uploaded data to Azure IoT Central.
- [Connect SenseCAP to Azure IoT Central via Node-RED](https://wiki.seeedstudio.com/K1100_SenseCAP_to_Azure_IoT_Central/)
- [Connect Wio Terminal to Microsoft Azure IoT Central (WiFi)](https://wiki.seeedstudio.com/Connect-Wio-Terminal-to-Azure-IoT-Central/)
## Create a Resource Group
Before you create your event hub and logic app, you need to create a **resource group** to manage them. The resource group should be in the same location as your In-store analytics - checkout IoT Central application. To create a resource group:
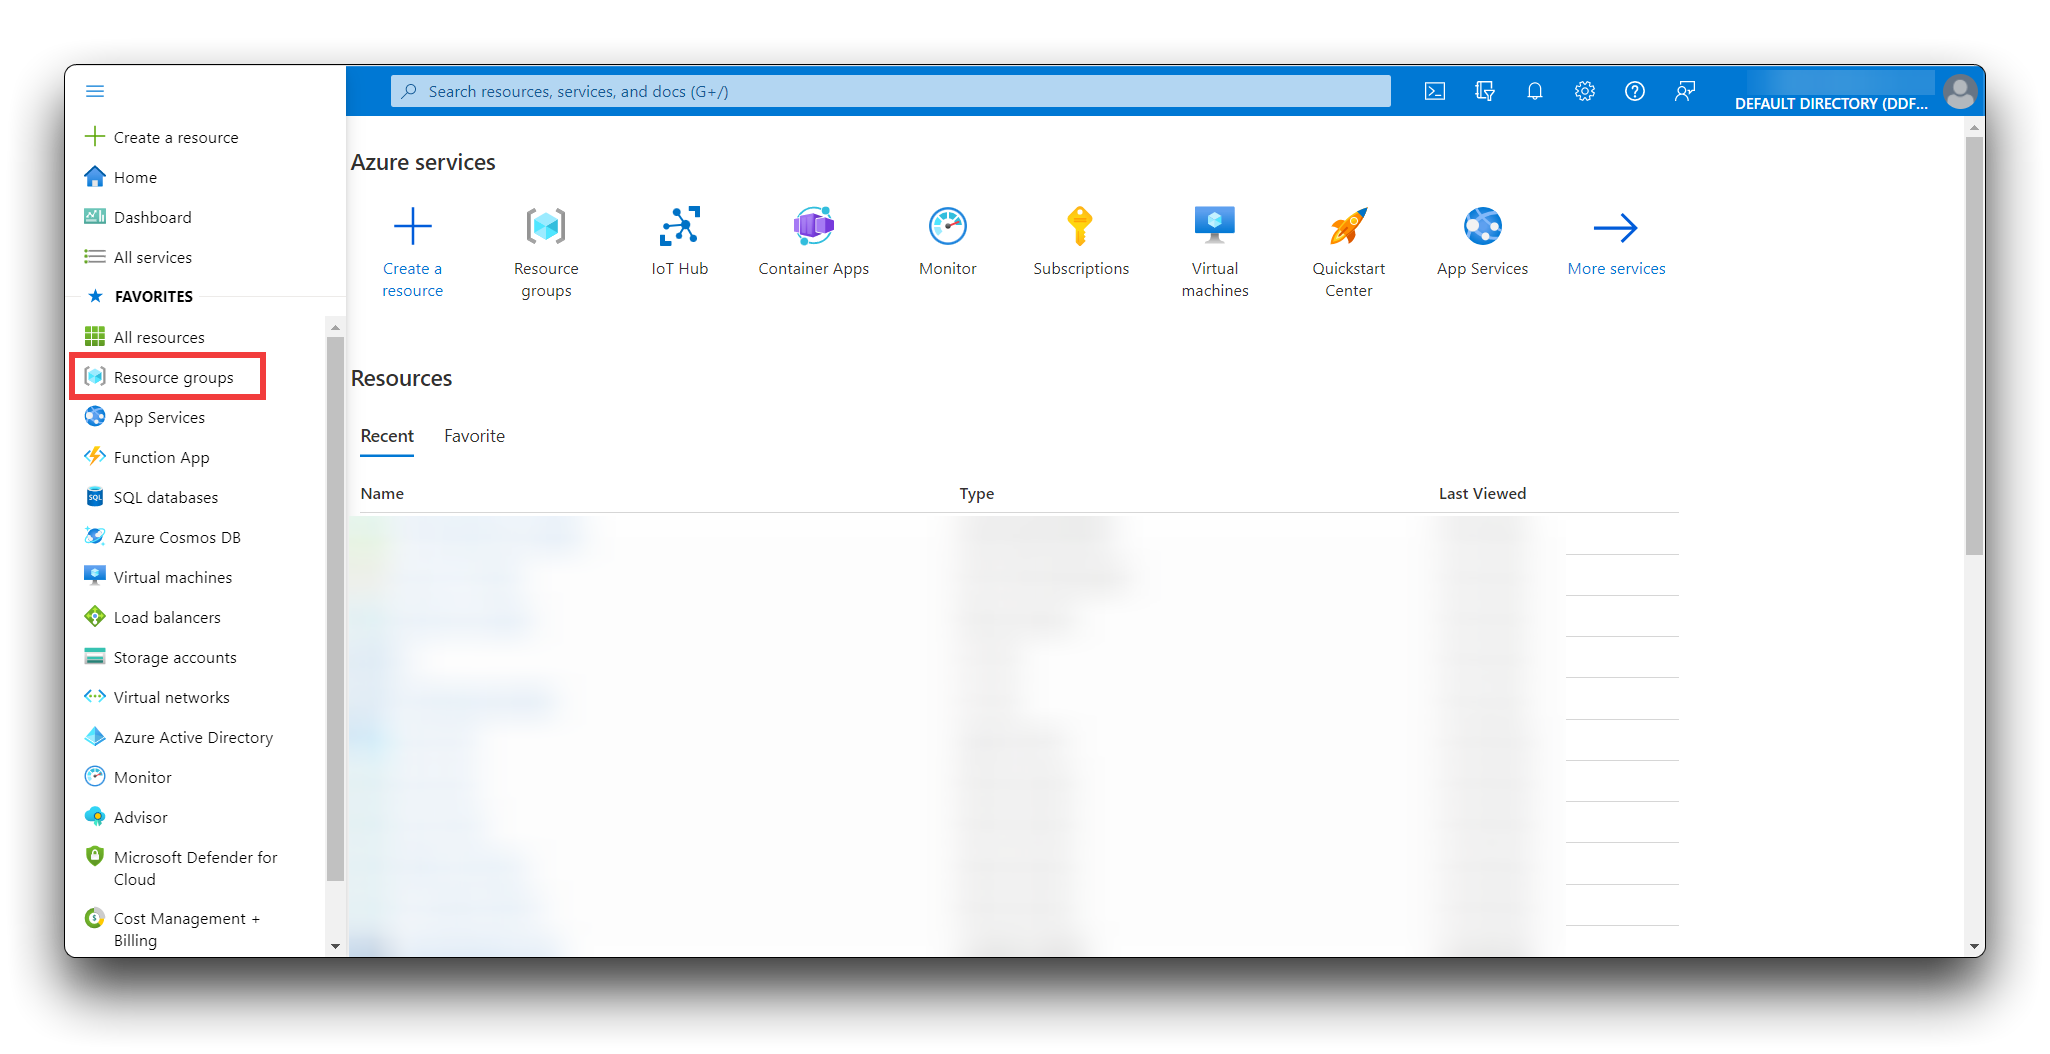
**Step 1.** Sign in to the [Azure portal](https://portal.azure.com/).
**Step 2.** In the left navigation, select **Resource groups**. Then select **Create**.
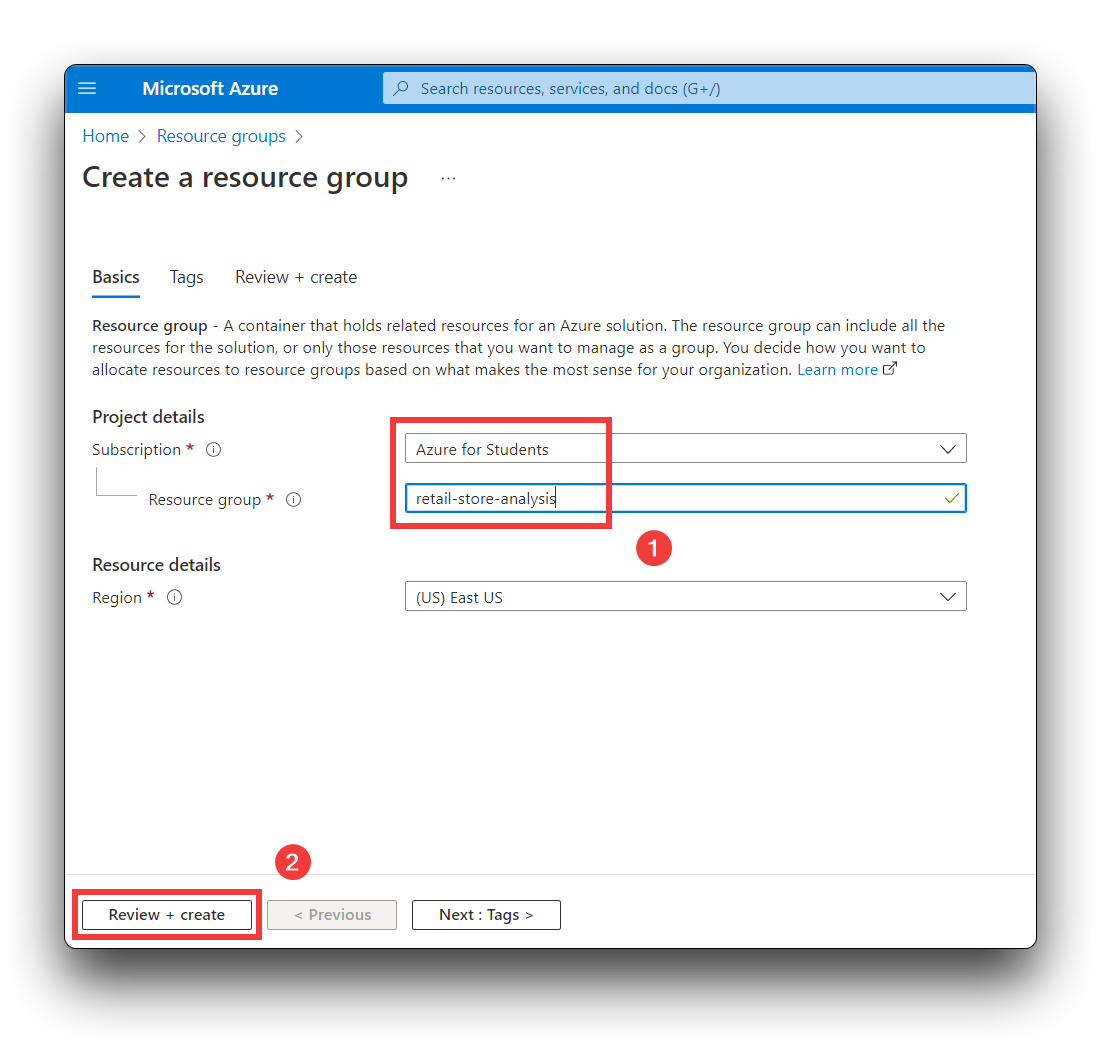
- For **Subscription**, select the name of the Azure subscription you used to create your IoT Central application.
- For the **Resource group** name, enter **retail-store-analysis**.
- For the **Region**, select the same region you chose for the IoT Central application.
**Step 3.** Select Review + Create.
On the Review + Create page, select Create.
You now have a resource group called retail-store-analysis in your subscription.
## Configure an Event Hub
Before you can configure the retail monitoring application to export telemetry, you need to create an event hub to receive the exported data. The following steps show you how to create your event hub:
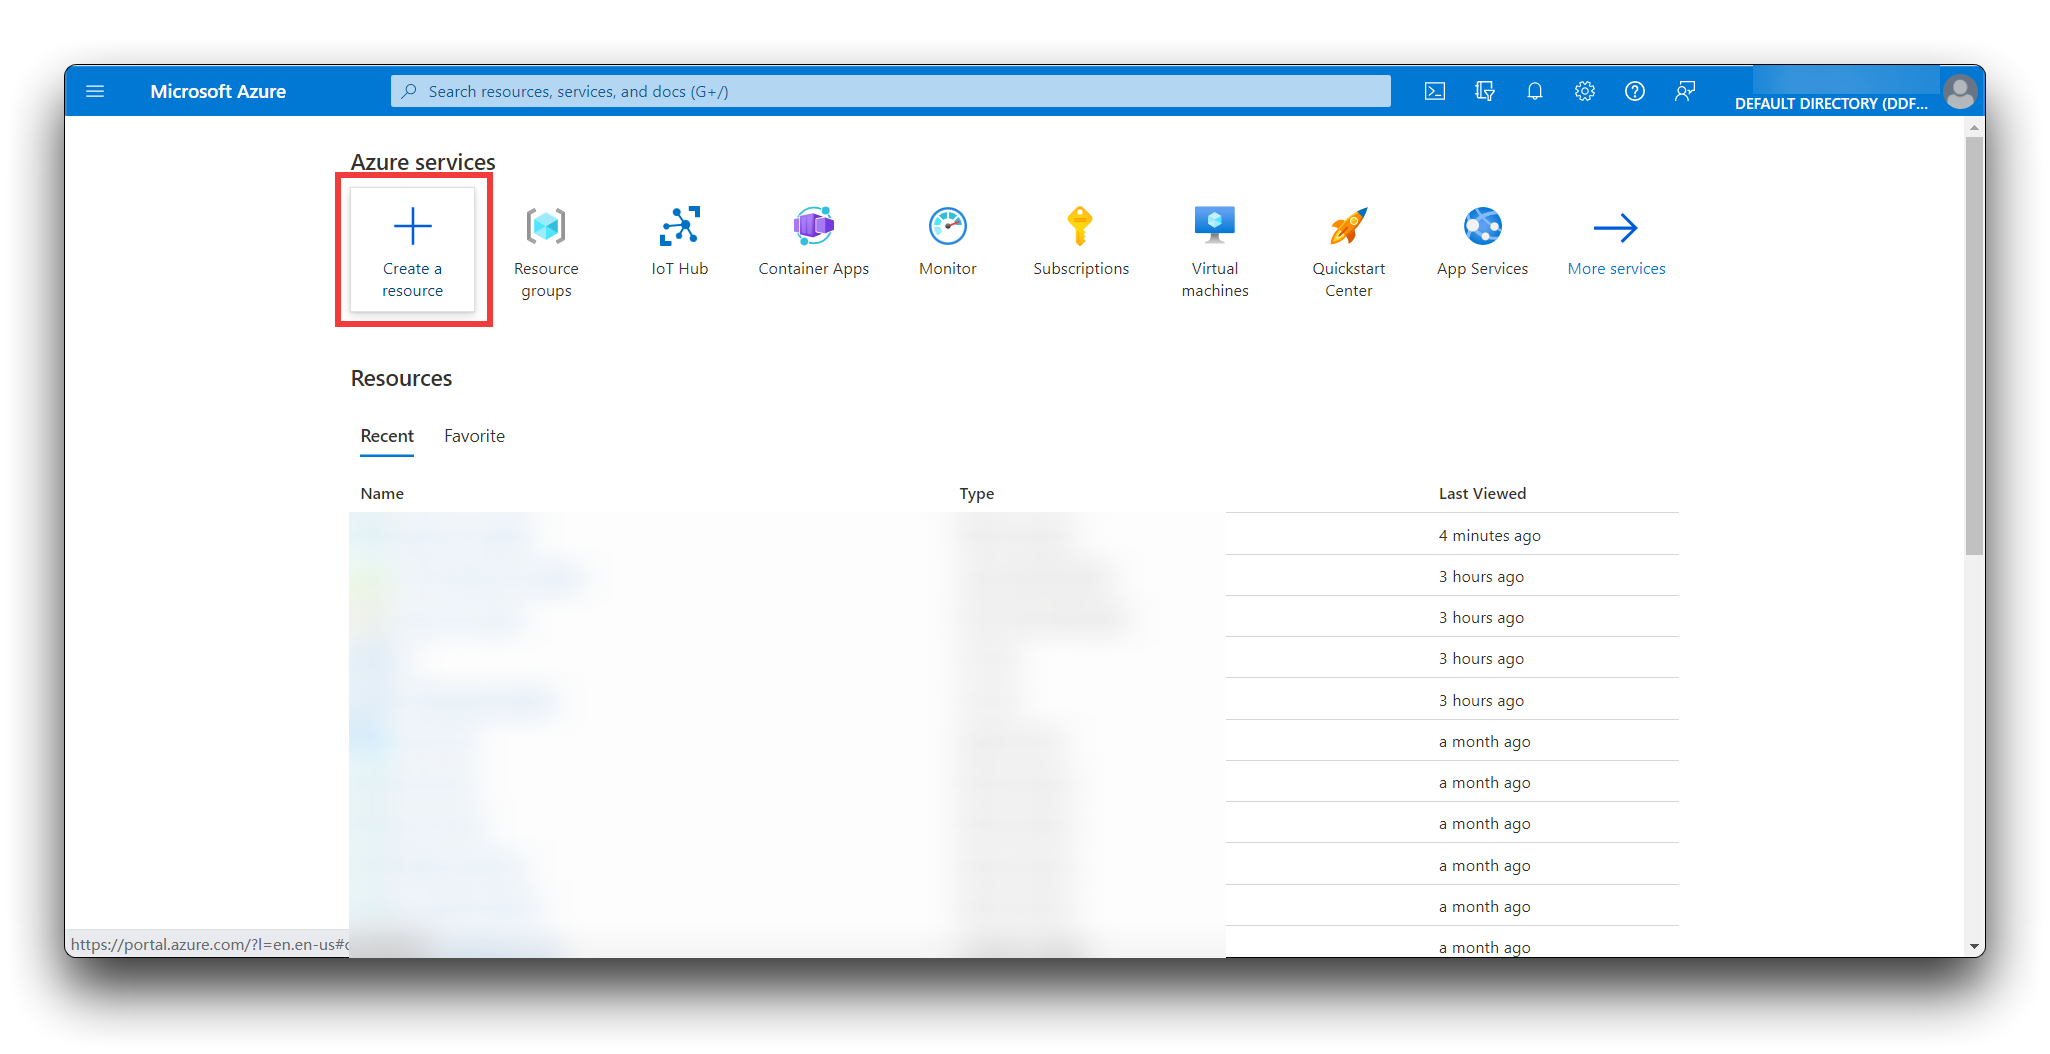
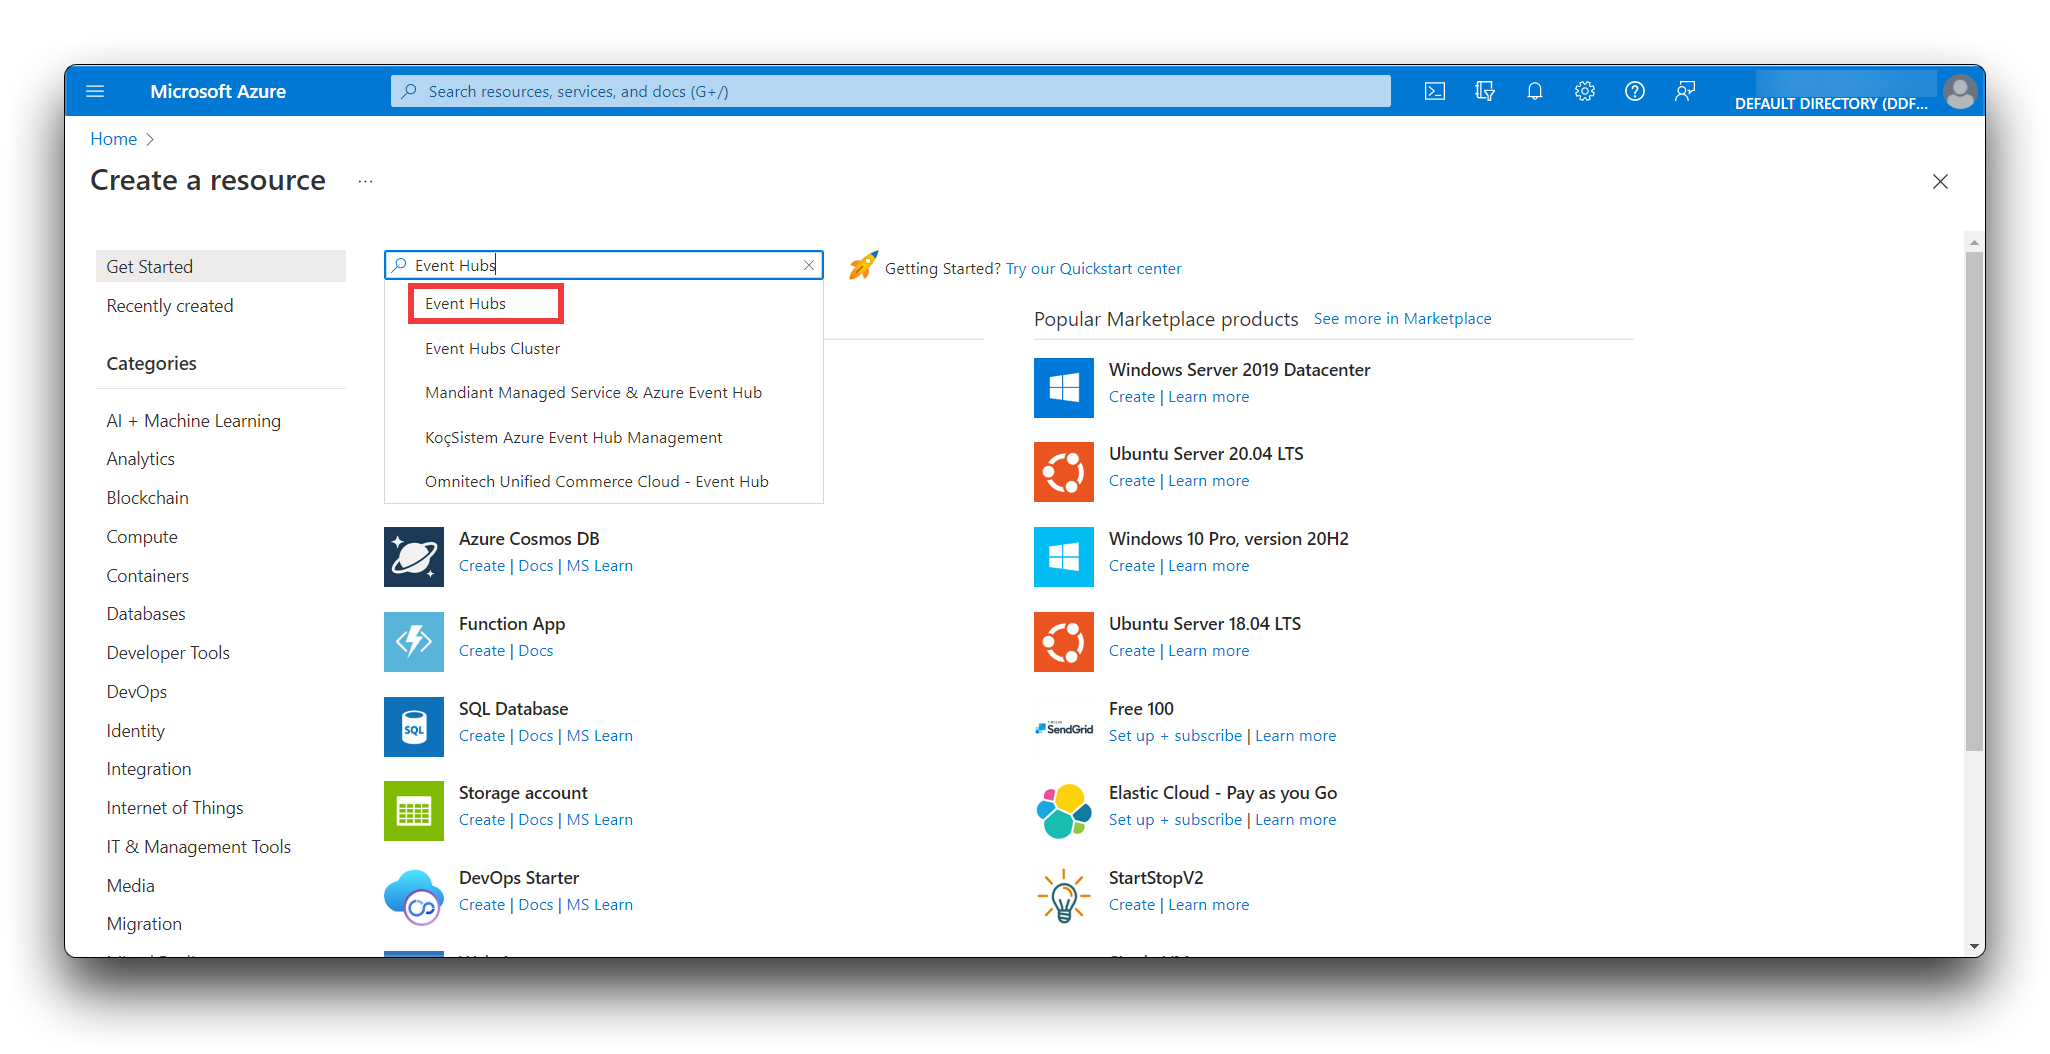
**Step 4.** In the [Azure portal](https://portal.azure.com/), select **Create a resource** at the top left of the screen.
**Step 5.** In Search the Marketplace, enter Event Hubs, and then press Enter.
**Step 6.** Create an event hub
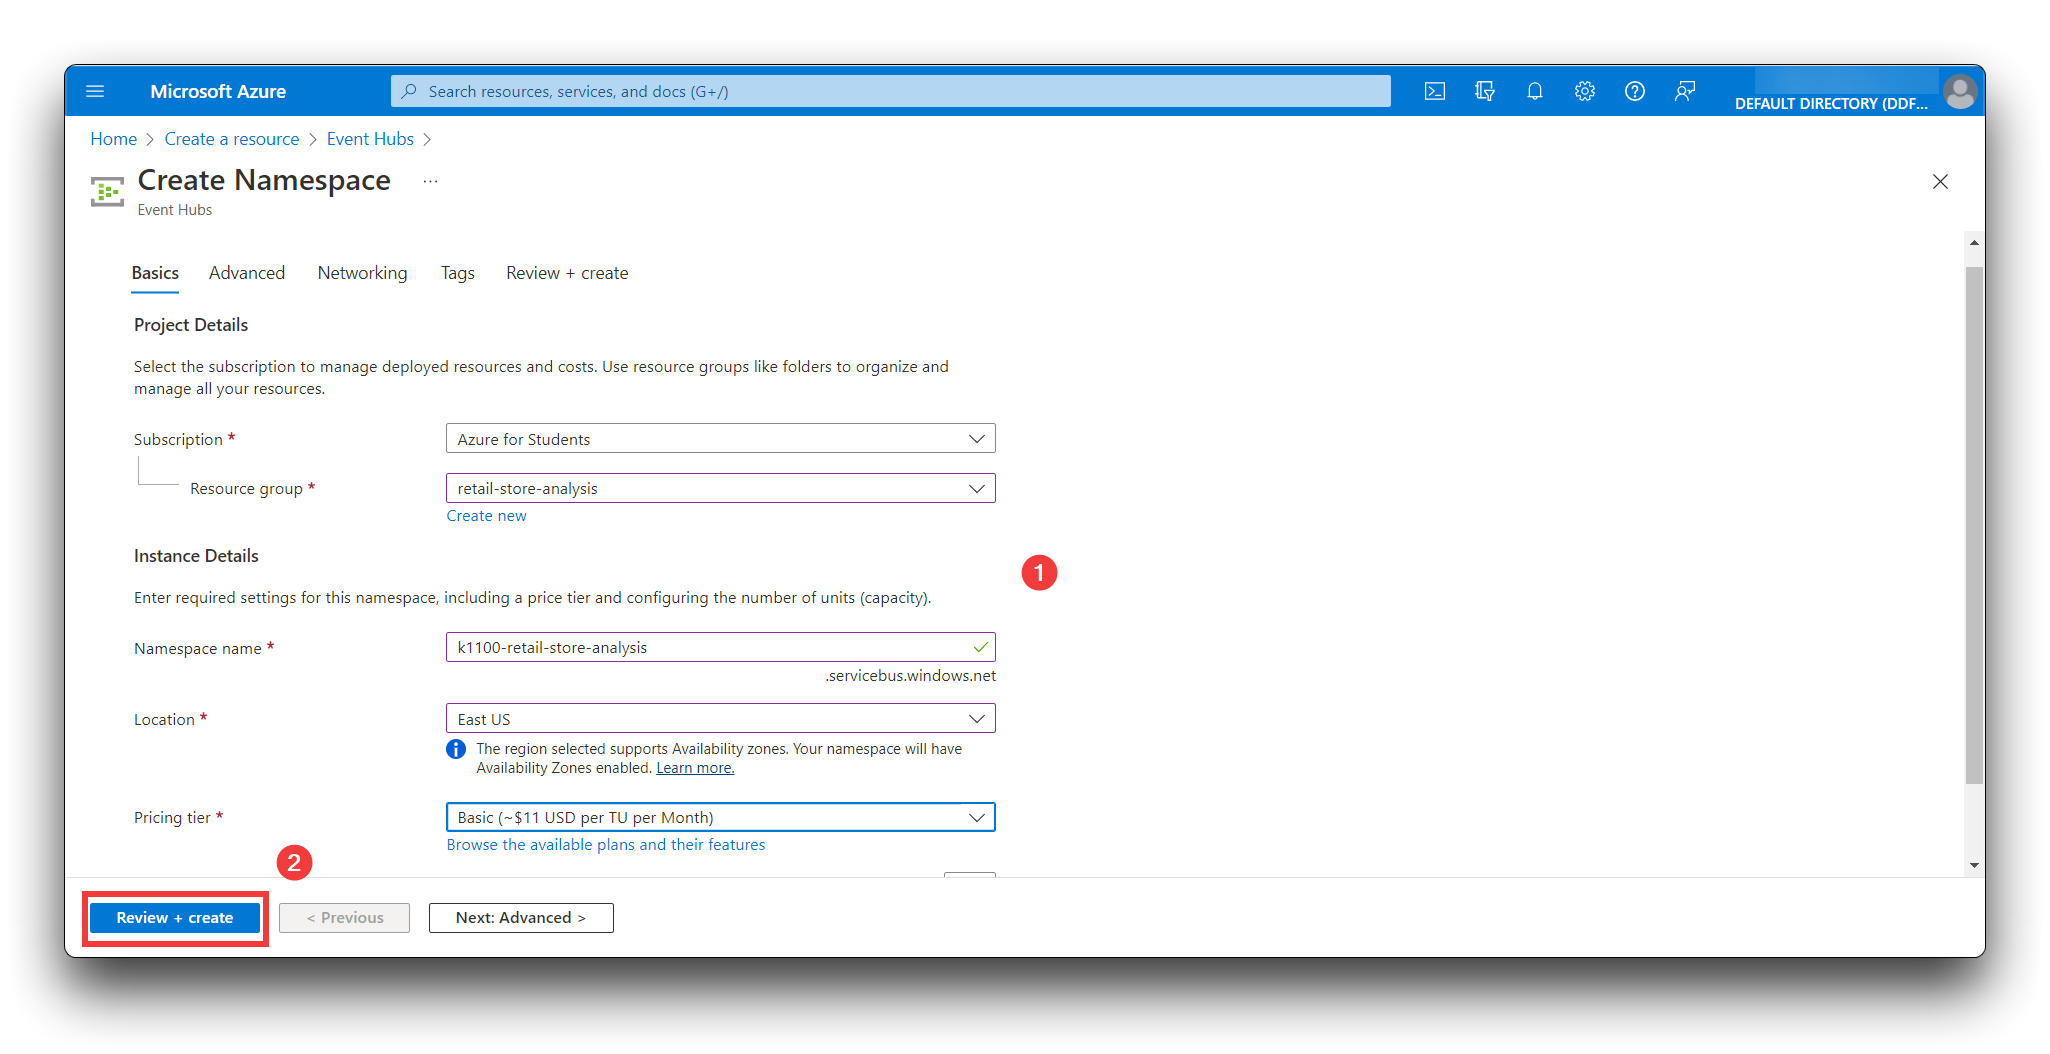
On the Event Hubs page, select Create. On the Create Namespace page, take the following steps:
- Select the same **Subscription** you used to create your IoT Central application.
- Select the **retail-store-analysis** resource group.
- Enter a unique name for the namespace such as **k1100-retail-store-analysis**.
- Select the same location you used for your IoT Central application.
- Choose the Basic pricing tier.
Select **Review + create**. You may have to wait a few minutes for the system to provision the resources.
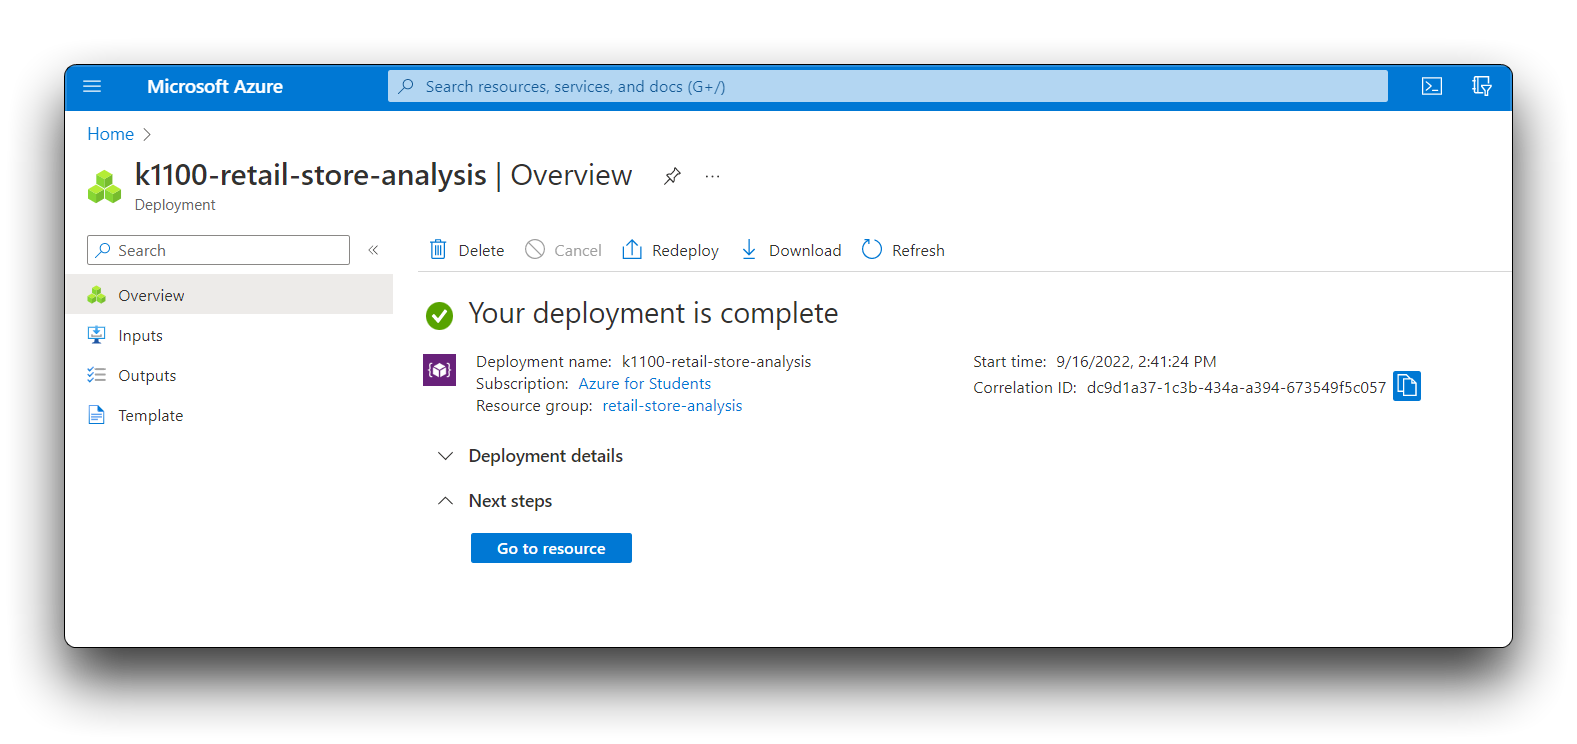
**Step 7.** Get an Event Hubs share key.
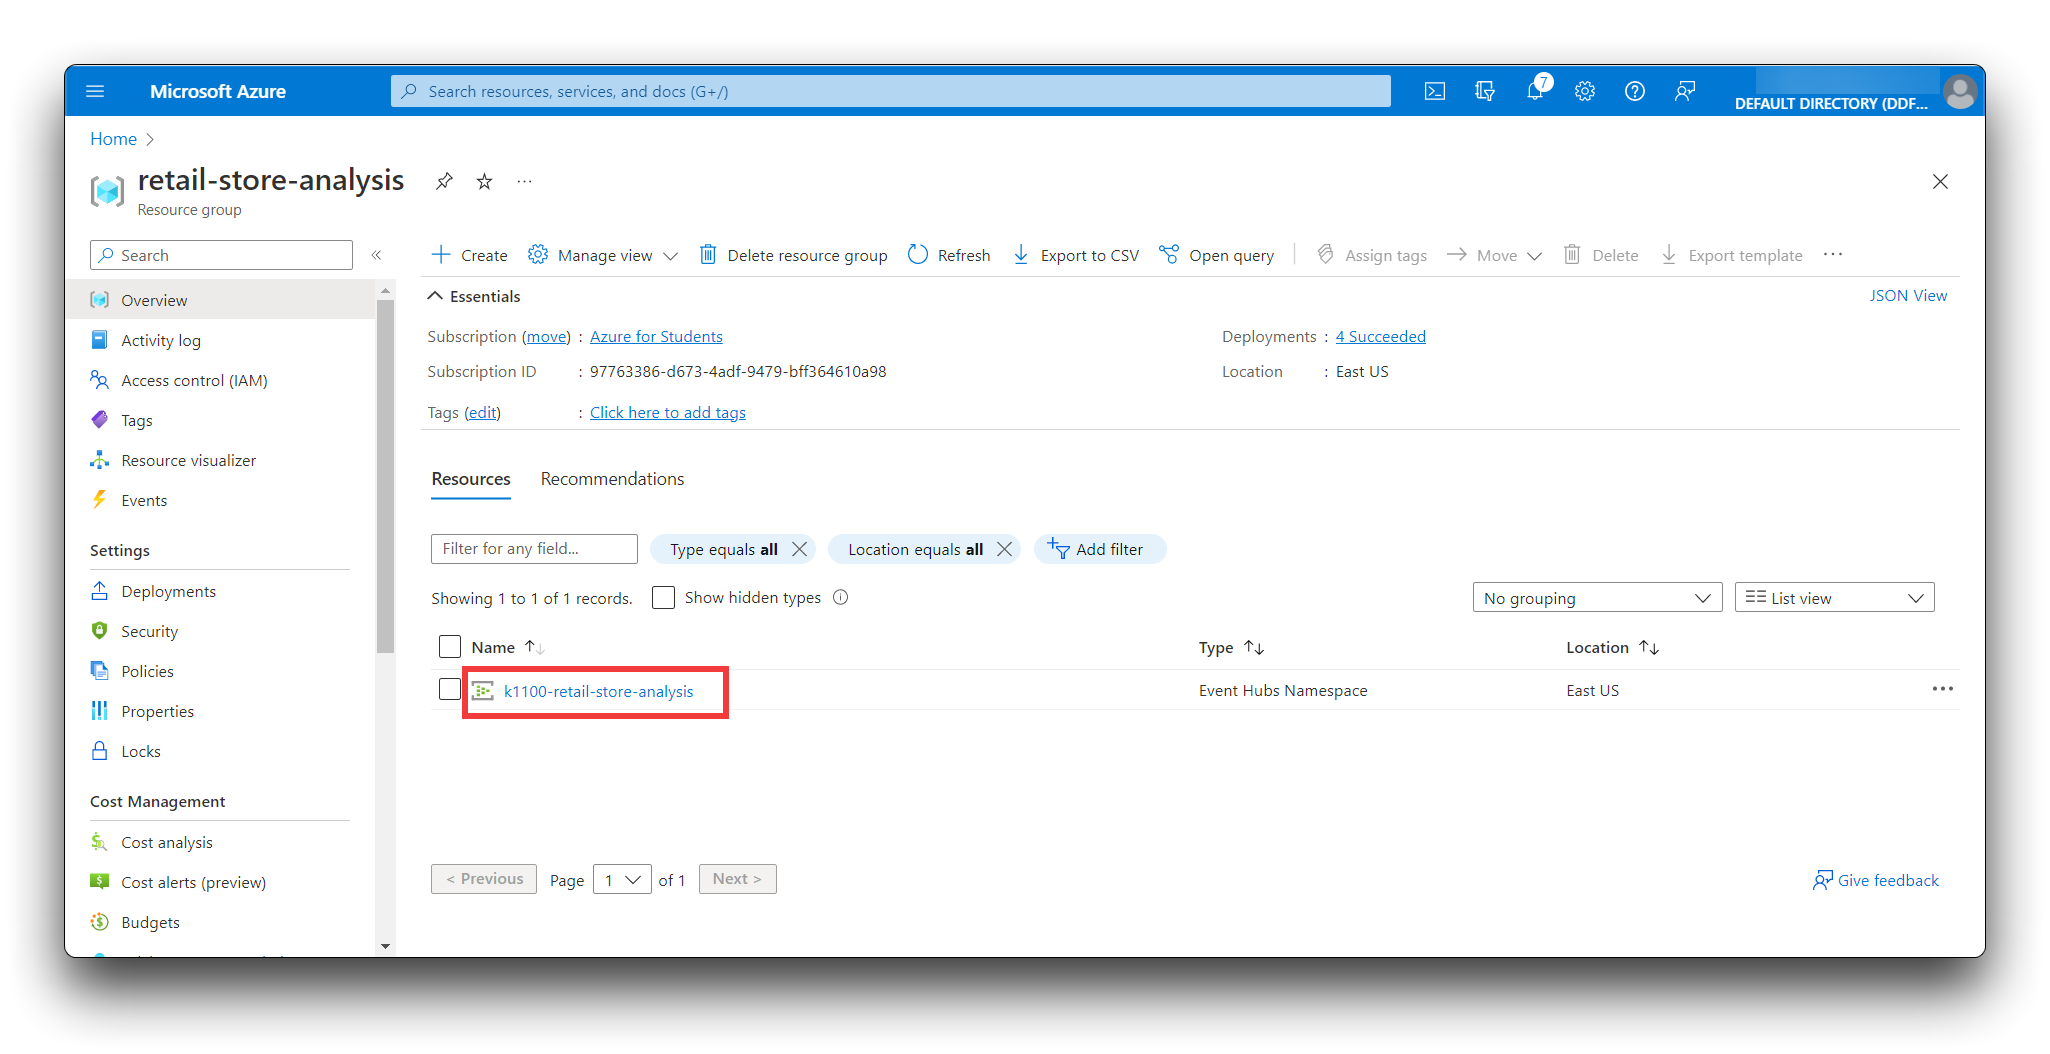
In the [Azure portal](https://portal.azure.com/), navigate to the **retail-store-analysis** resource group.
Wait for the deployment to complete. You may need to select Refresh to update the deployment status. You can also check the status of the event hub namespace creation in the Notifications.
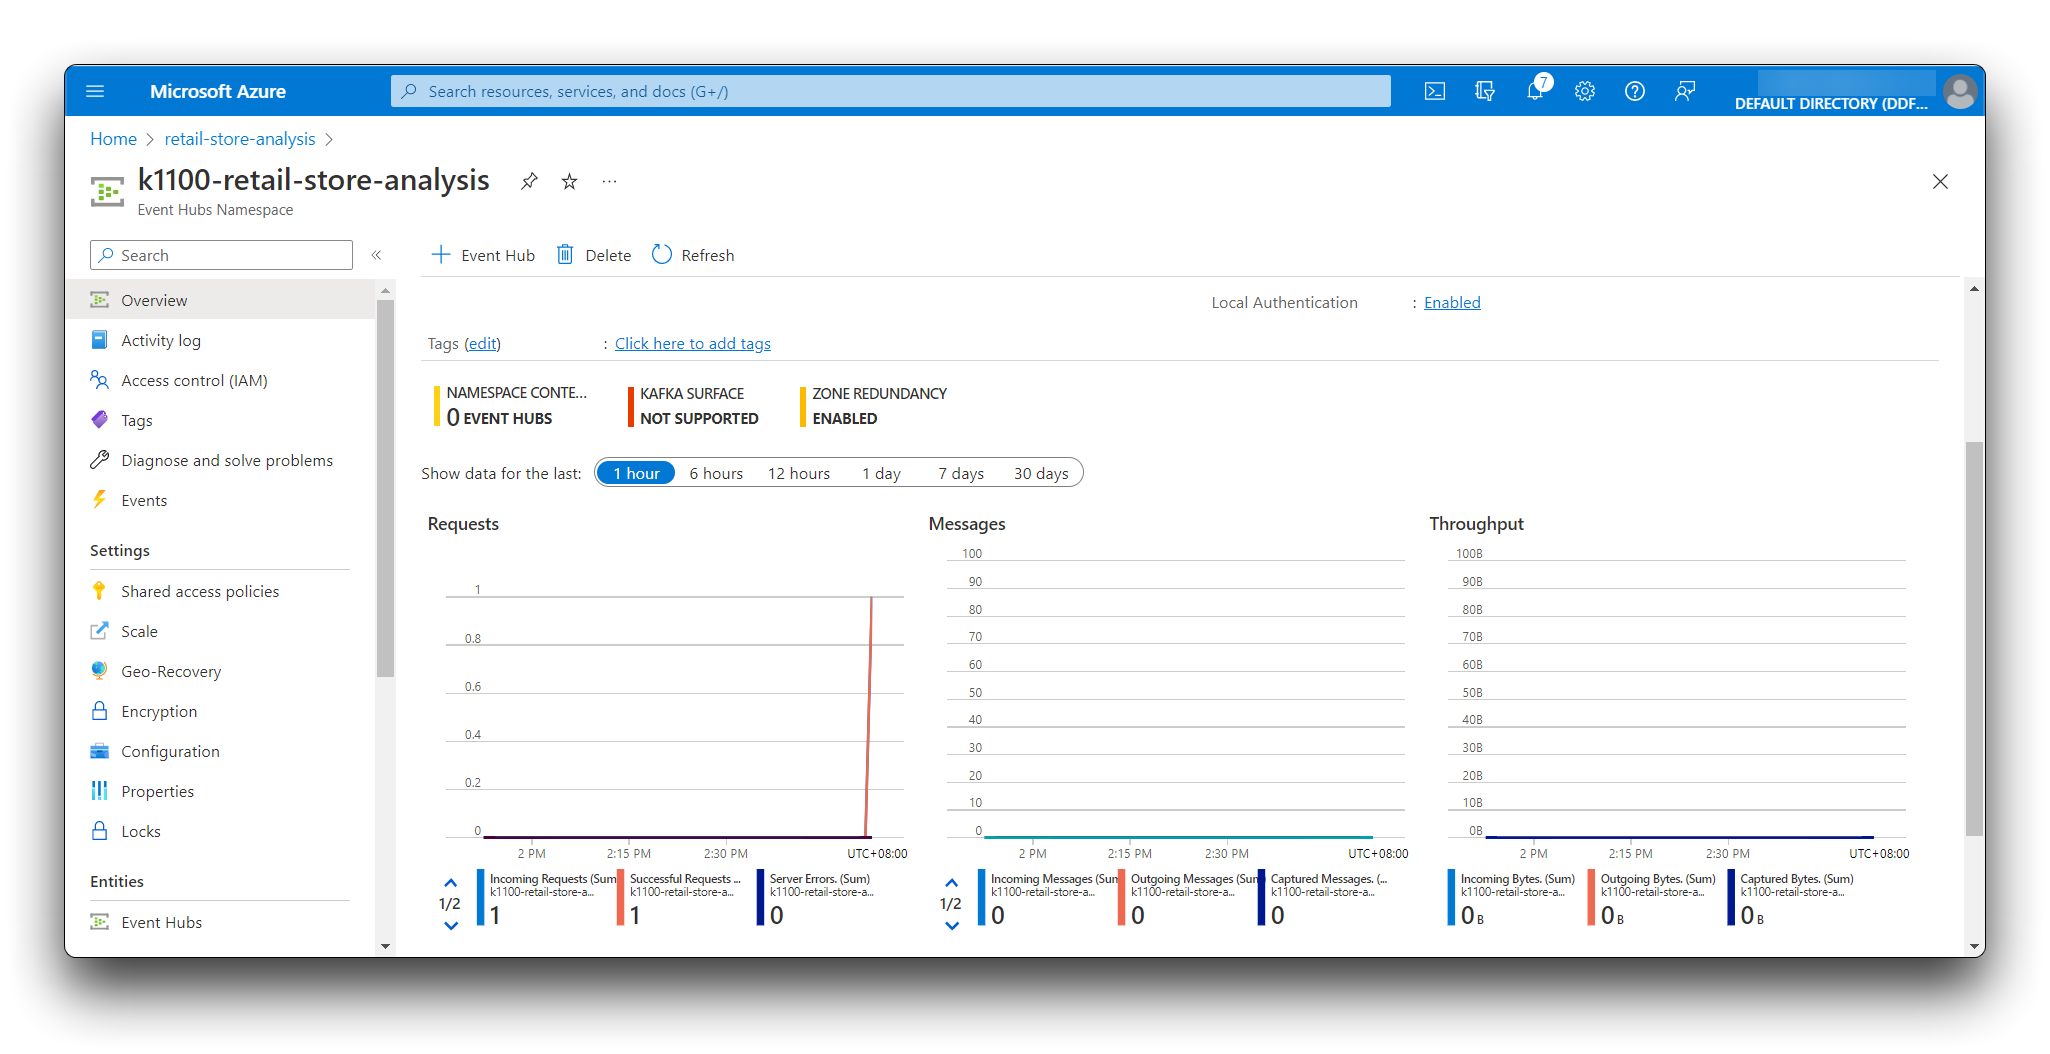
In the **retail-store-analysis** resource group, select the **Event Hubs Namespace**.
You see the home page for your Event Hubs Namespace in the portal.
You need a **connection string** with send permissions to connect from IoT Central. To create a connection string:
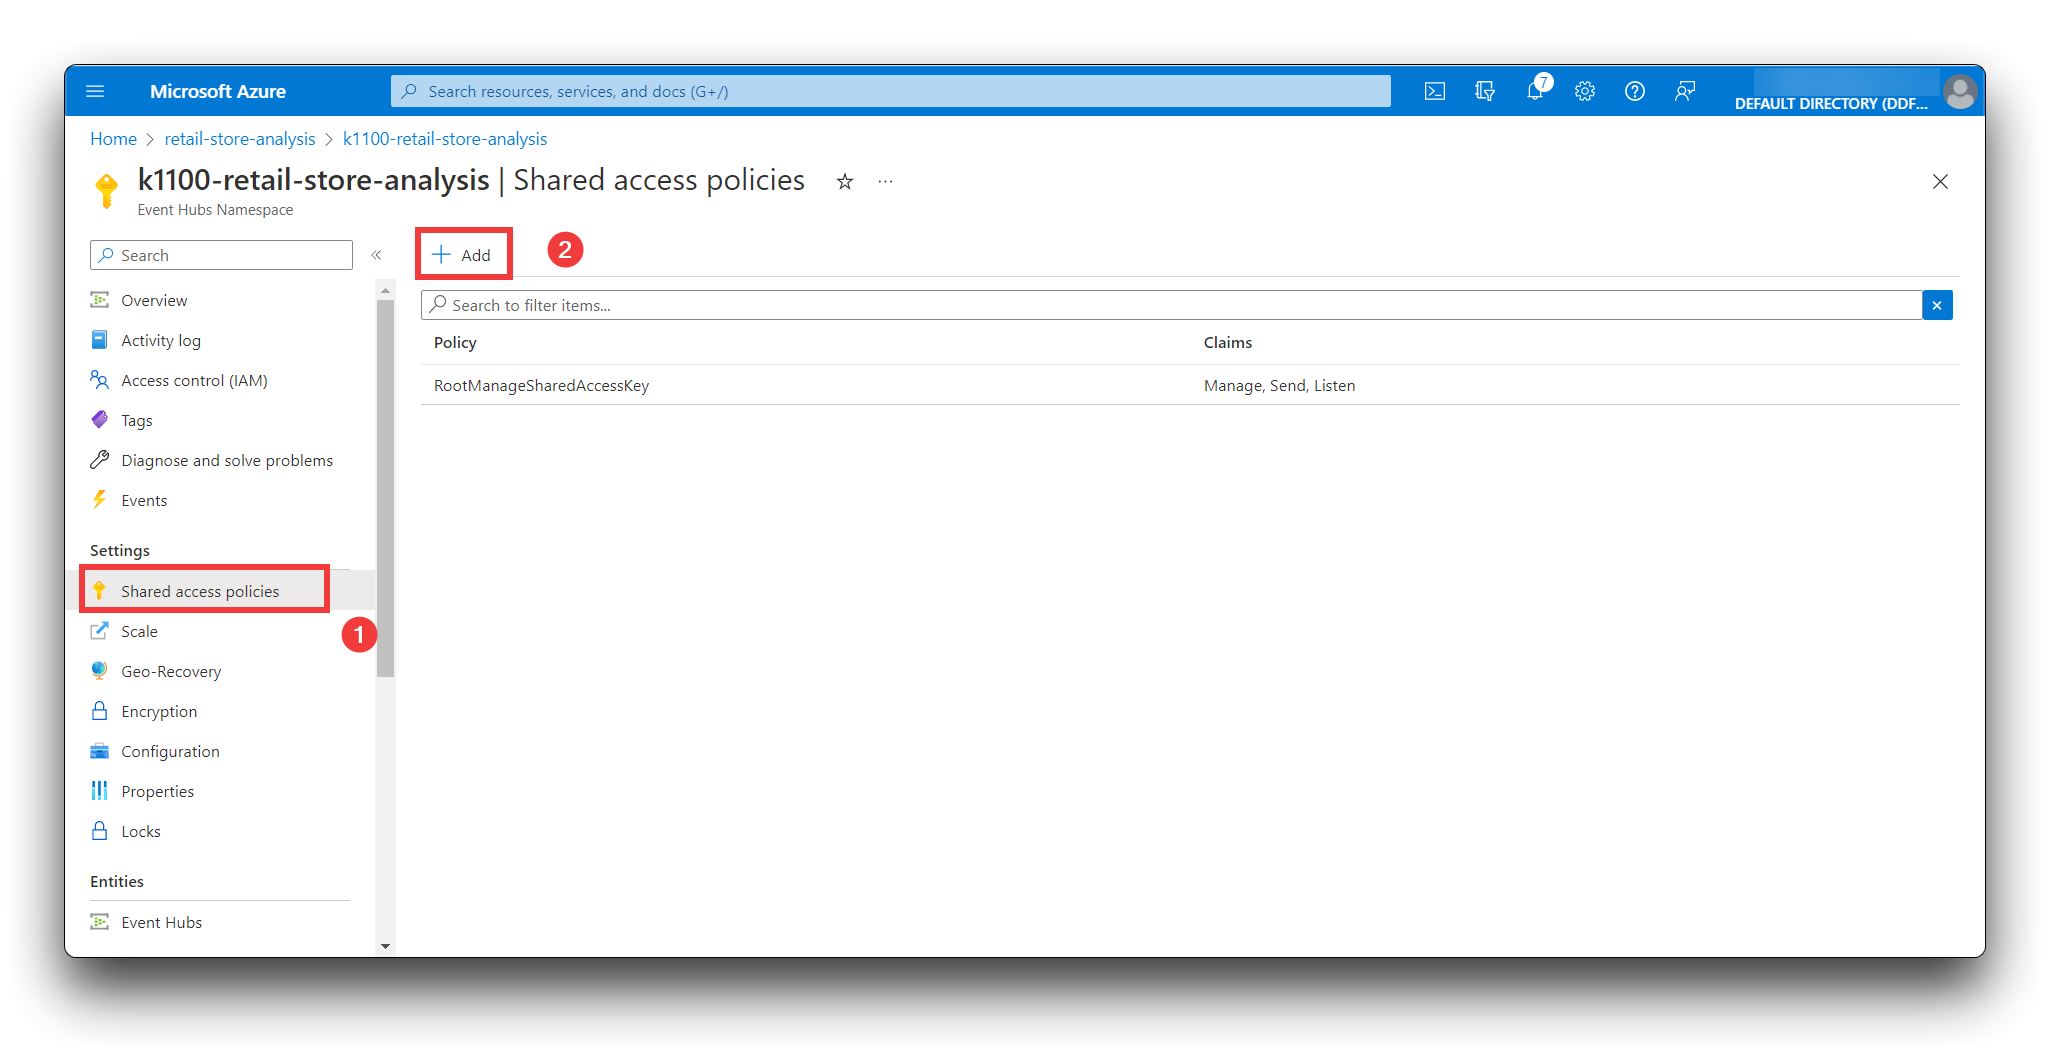
- In your Event Hubs namespace in the Azure portal, select **Shared access policies**. Select **+ Add**.
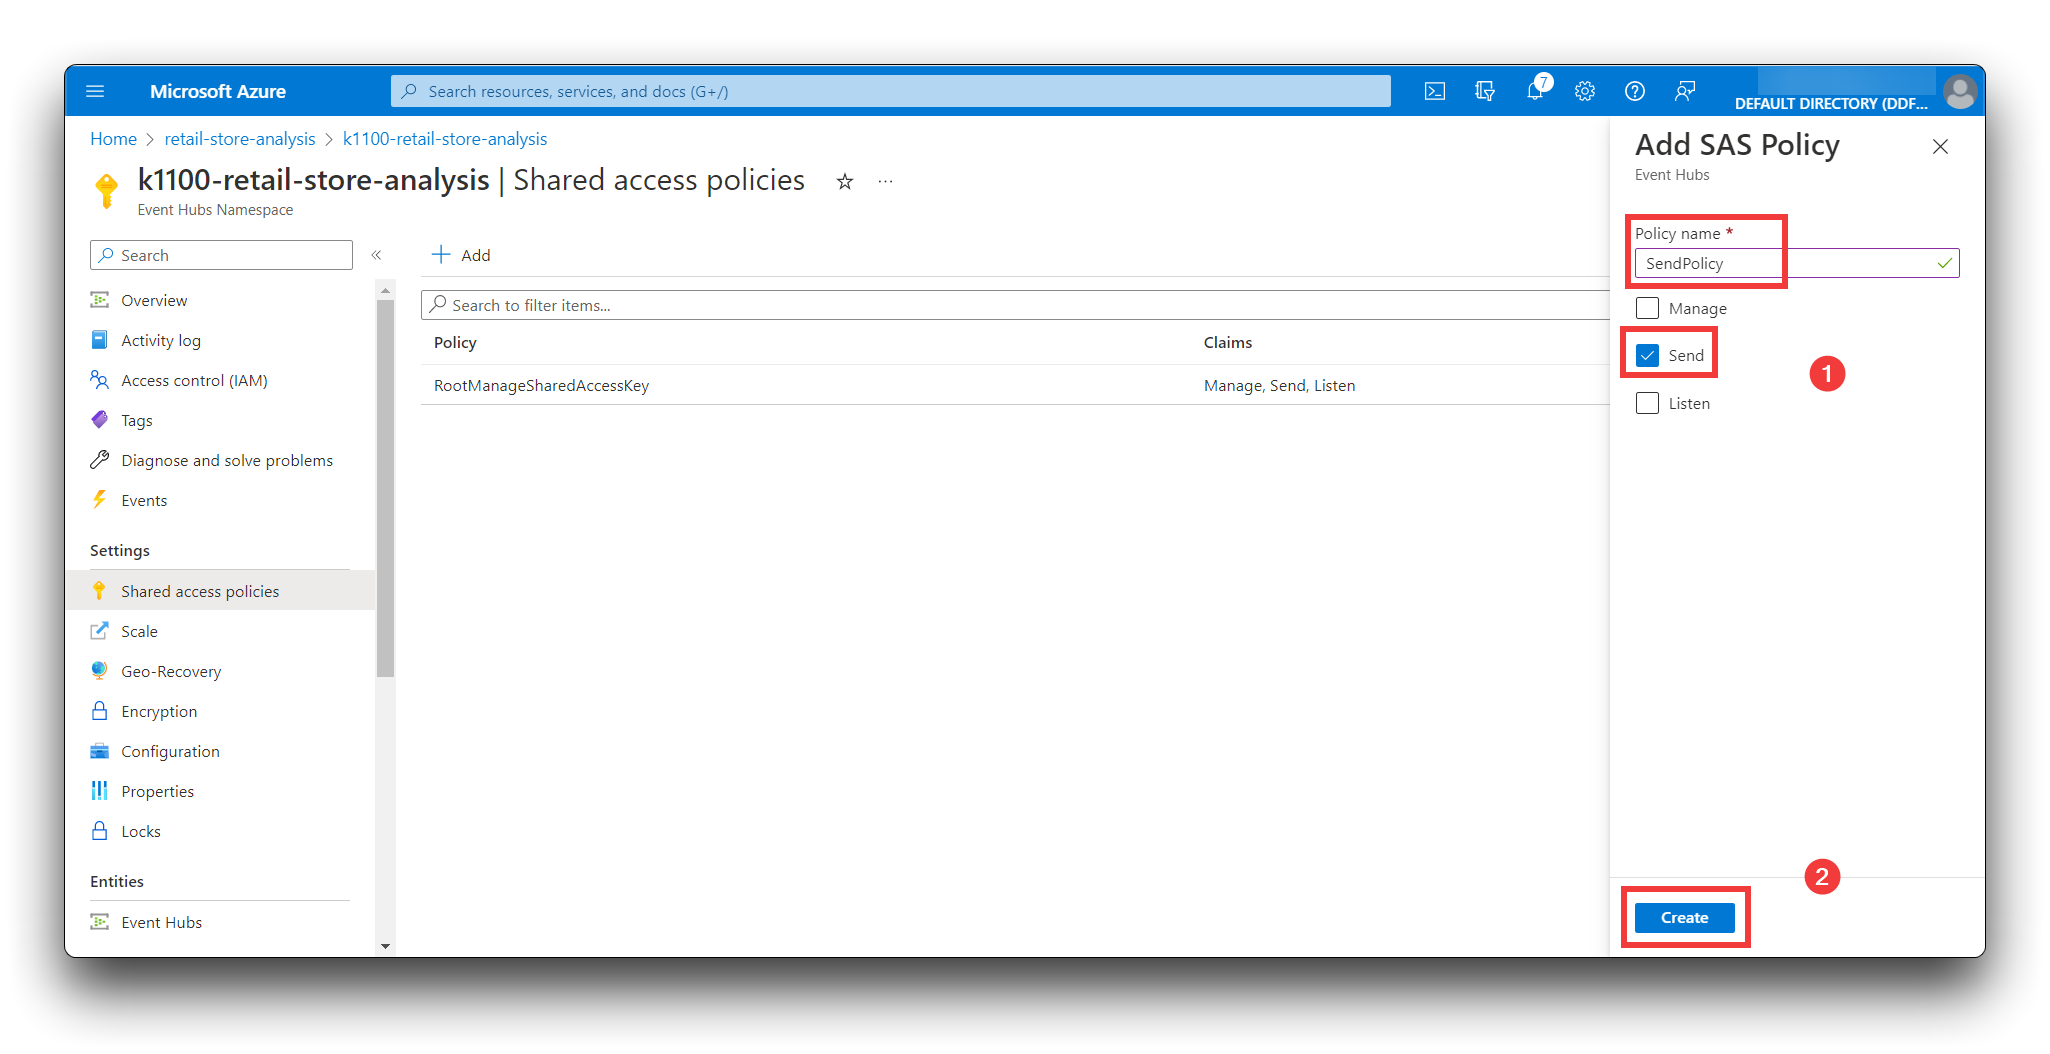
- Enter **SendPolicy** as the policy name, select **Send**, and then select Create.
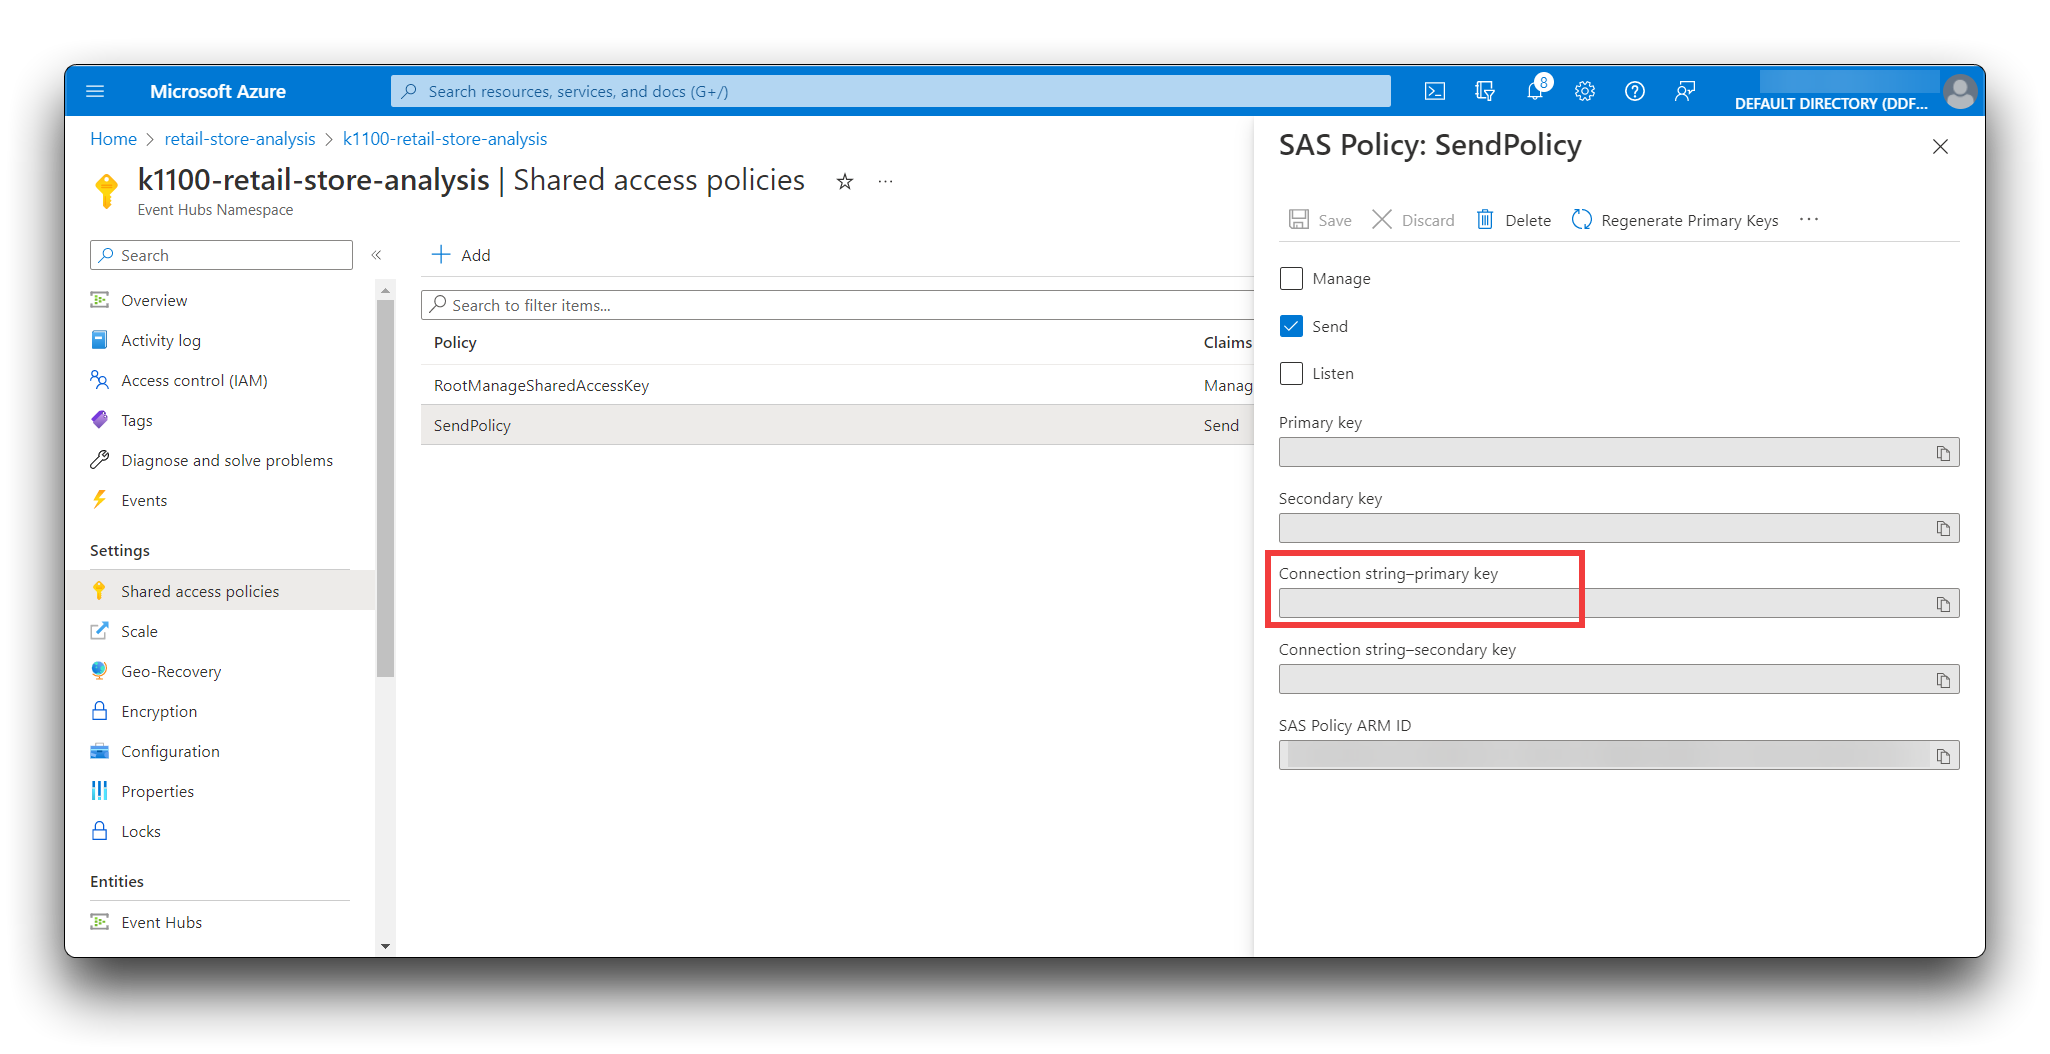
- Select **SendPolicy** in the list of policies. Make a note of the **Connection string-primary key** value. You use it when you configure the export destination in IoT Central.
**Step 8.** Get an Event Hubs manage and listen key.
You need a connection string with manage and listen permissions to connect to the event hub from your logic app. To retrieve a connection string:
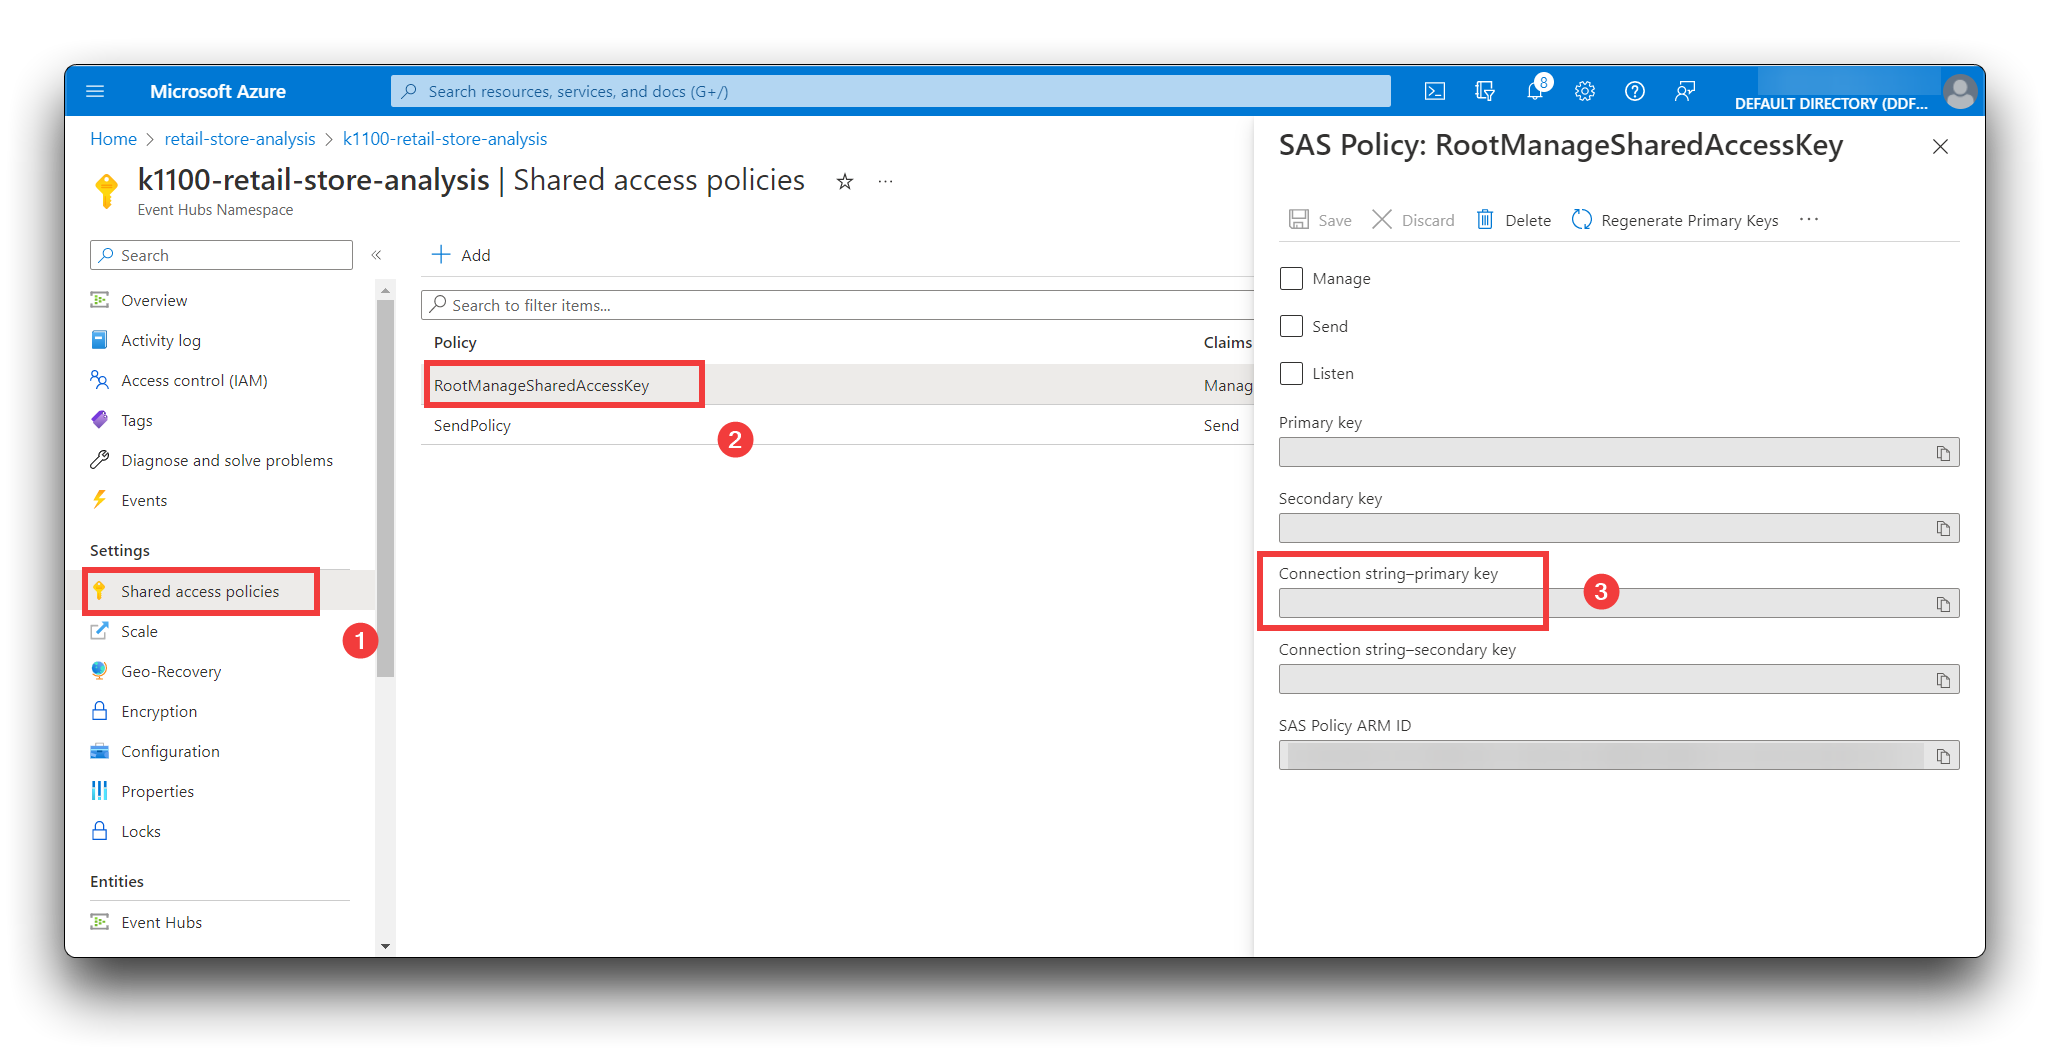
- In your Event Hubs namespace in the Azure portal, select Shared access policies.
- Select **RootManageSharedAccessKey** in the list of policies.
Make a note of the **Connection string-primary key** value. You use it when you configure the logic app to fetch telemetry from your event hub.
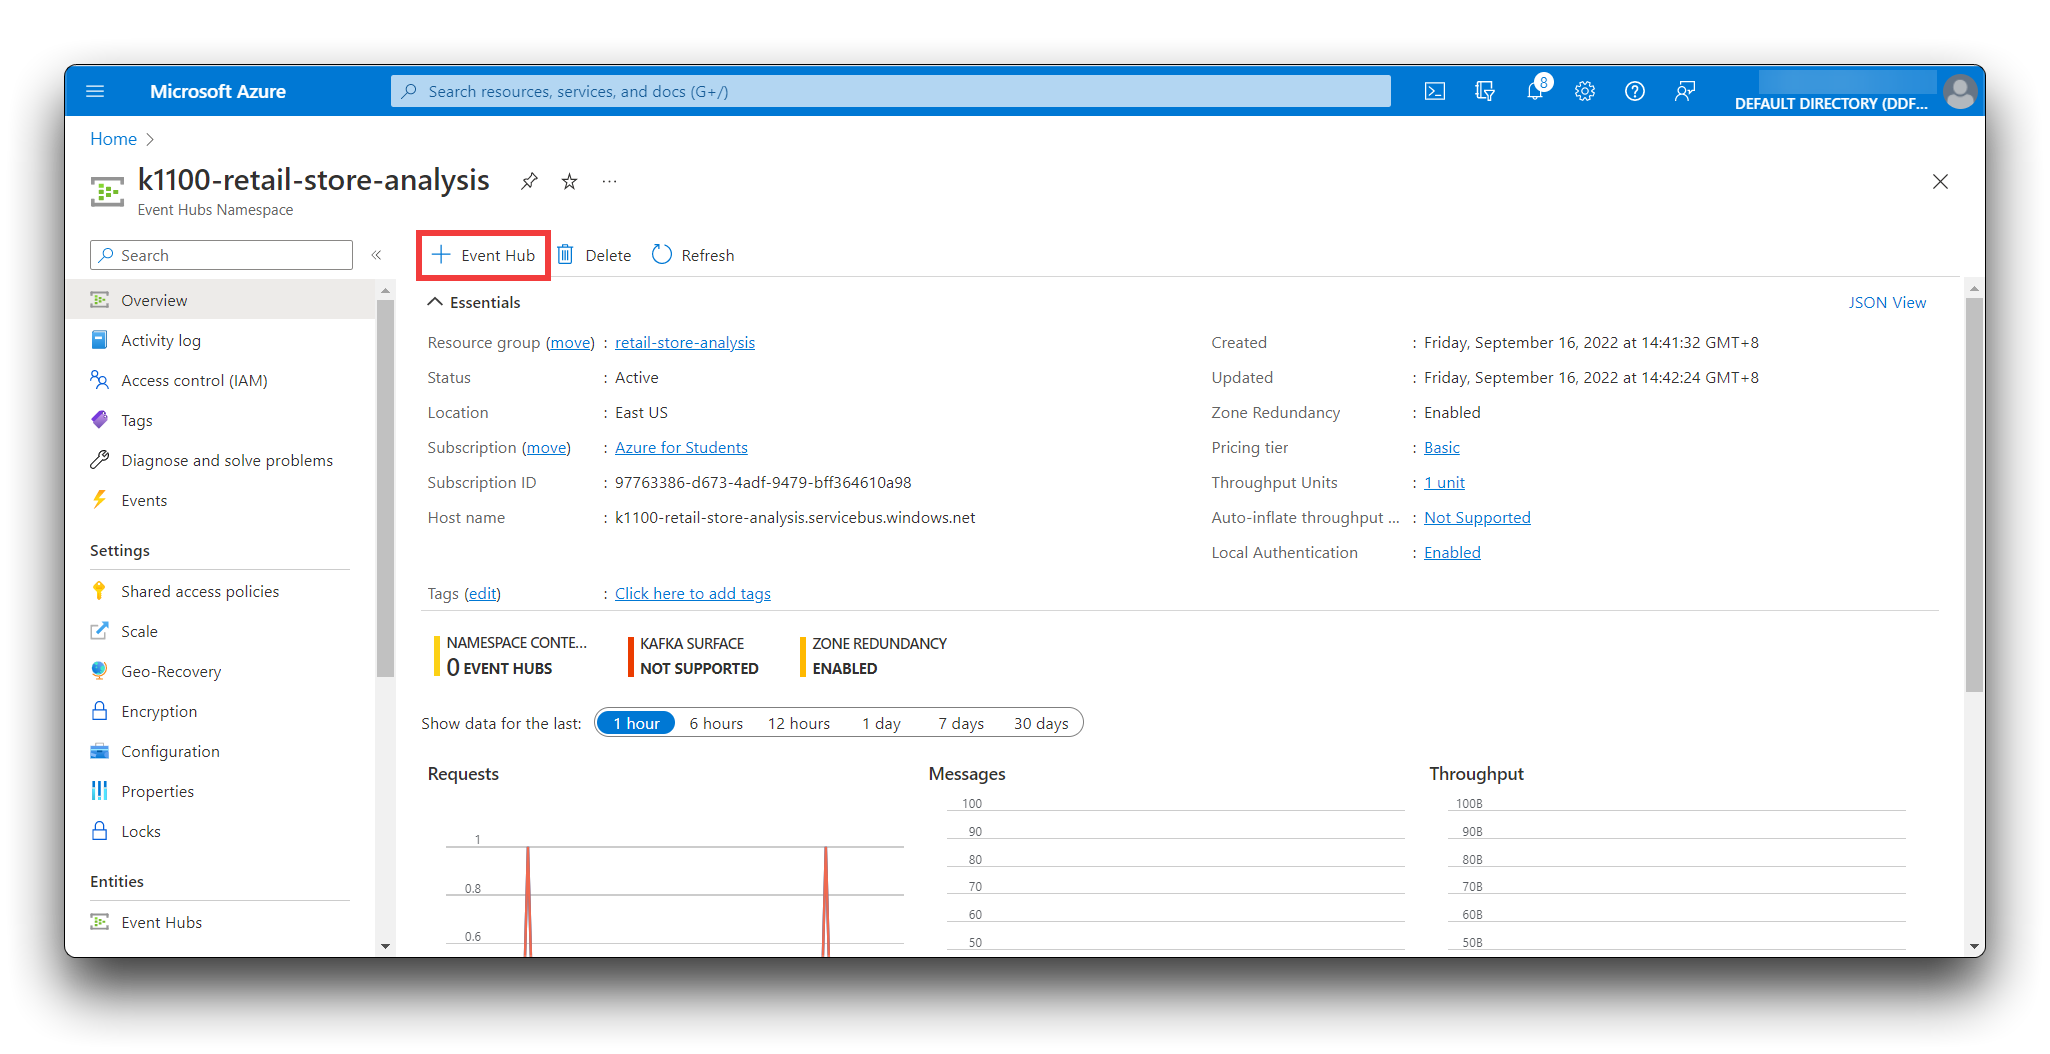
**Step 8.** Create an event hub to use.
Now you have an Event Hubs Namespace, you can create an event hub to use with your IoT Central application:
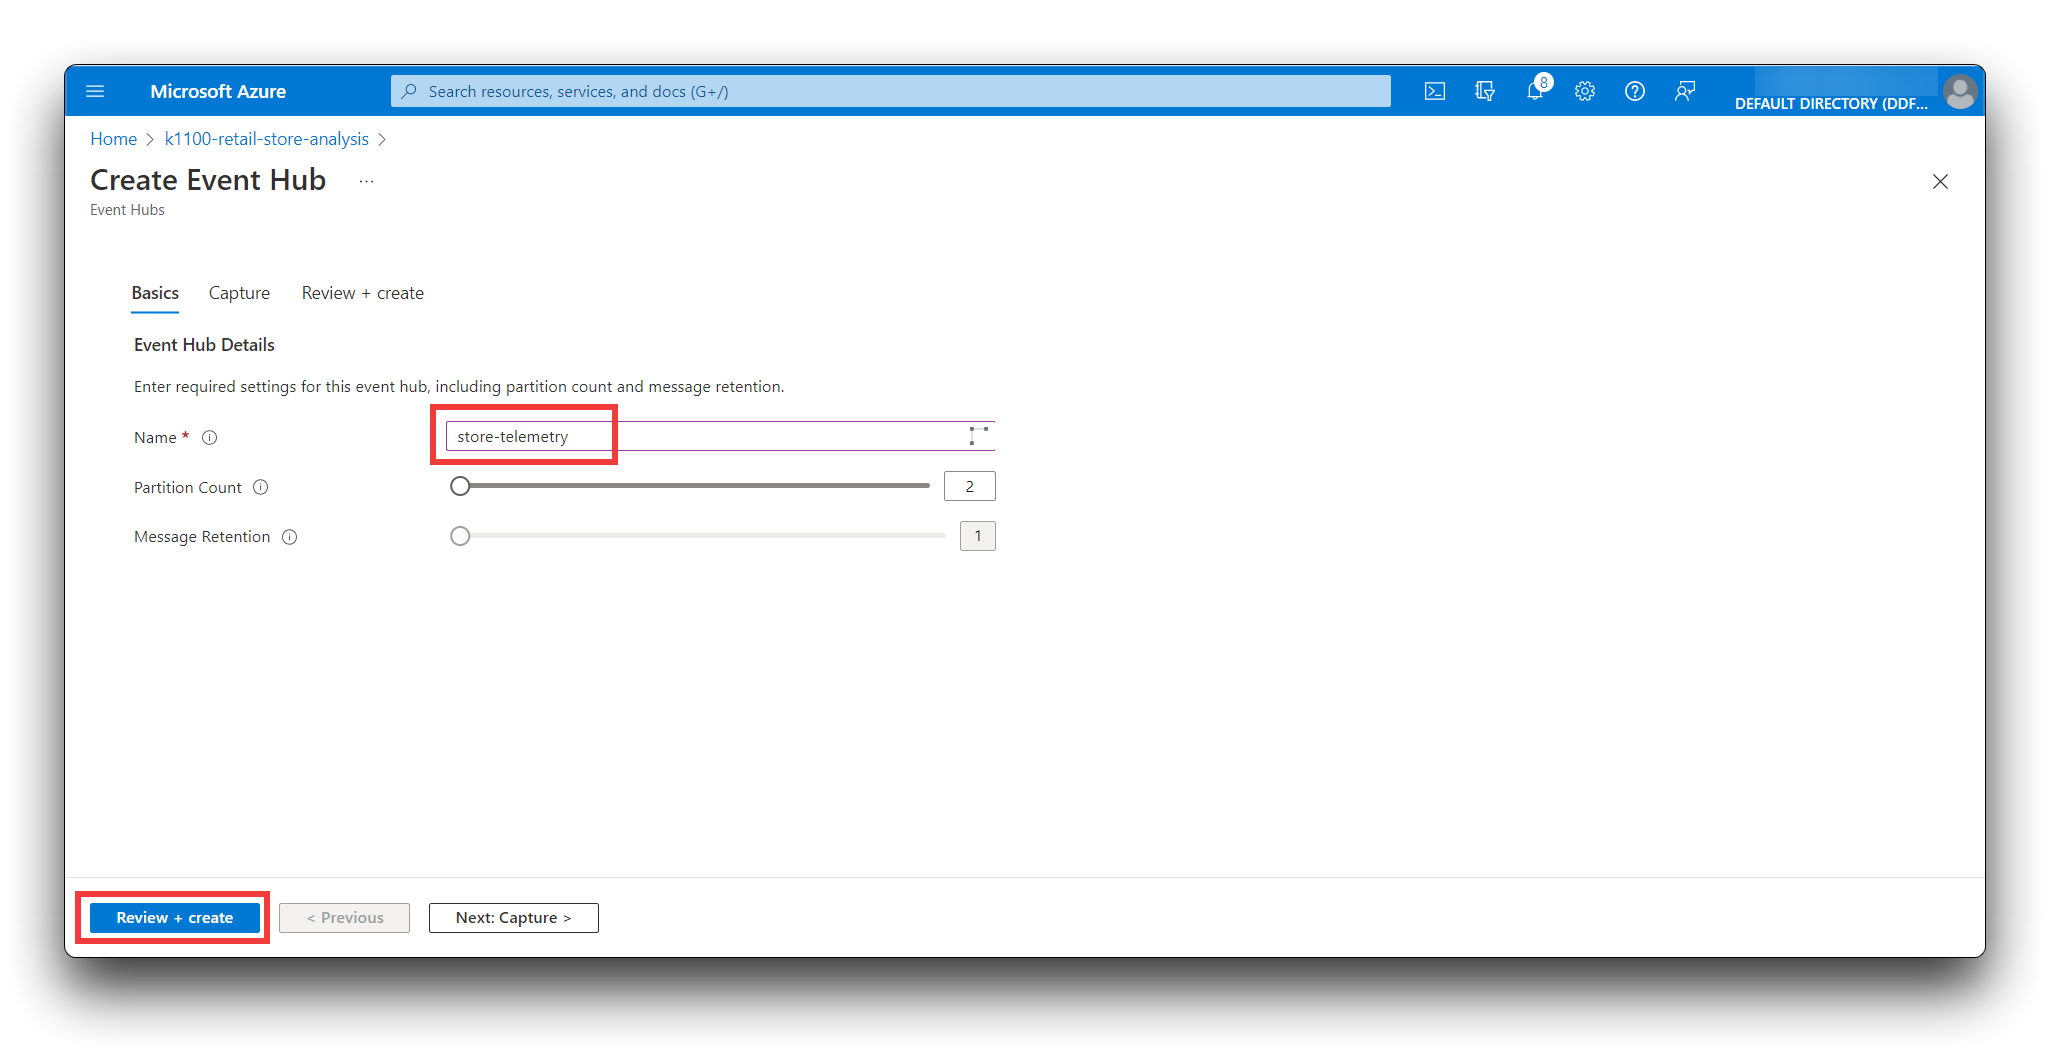
- On the home page for your Event Hubs Namespace in the portal, select **+ Event Hub**.
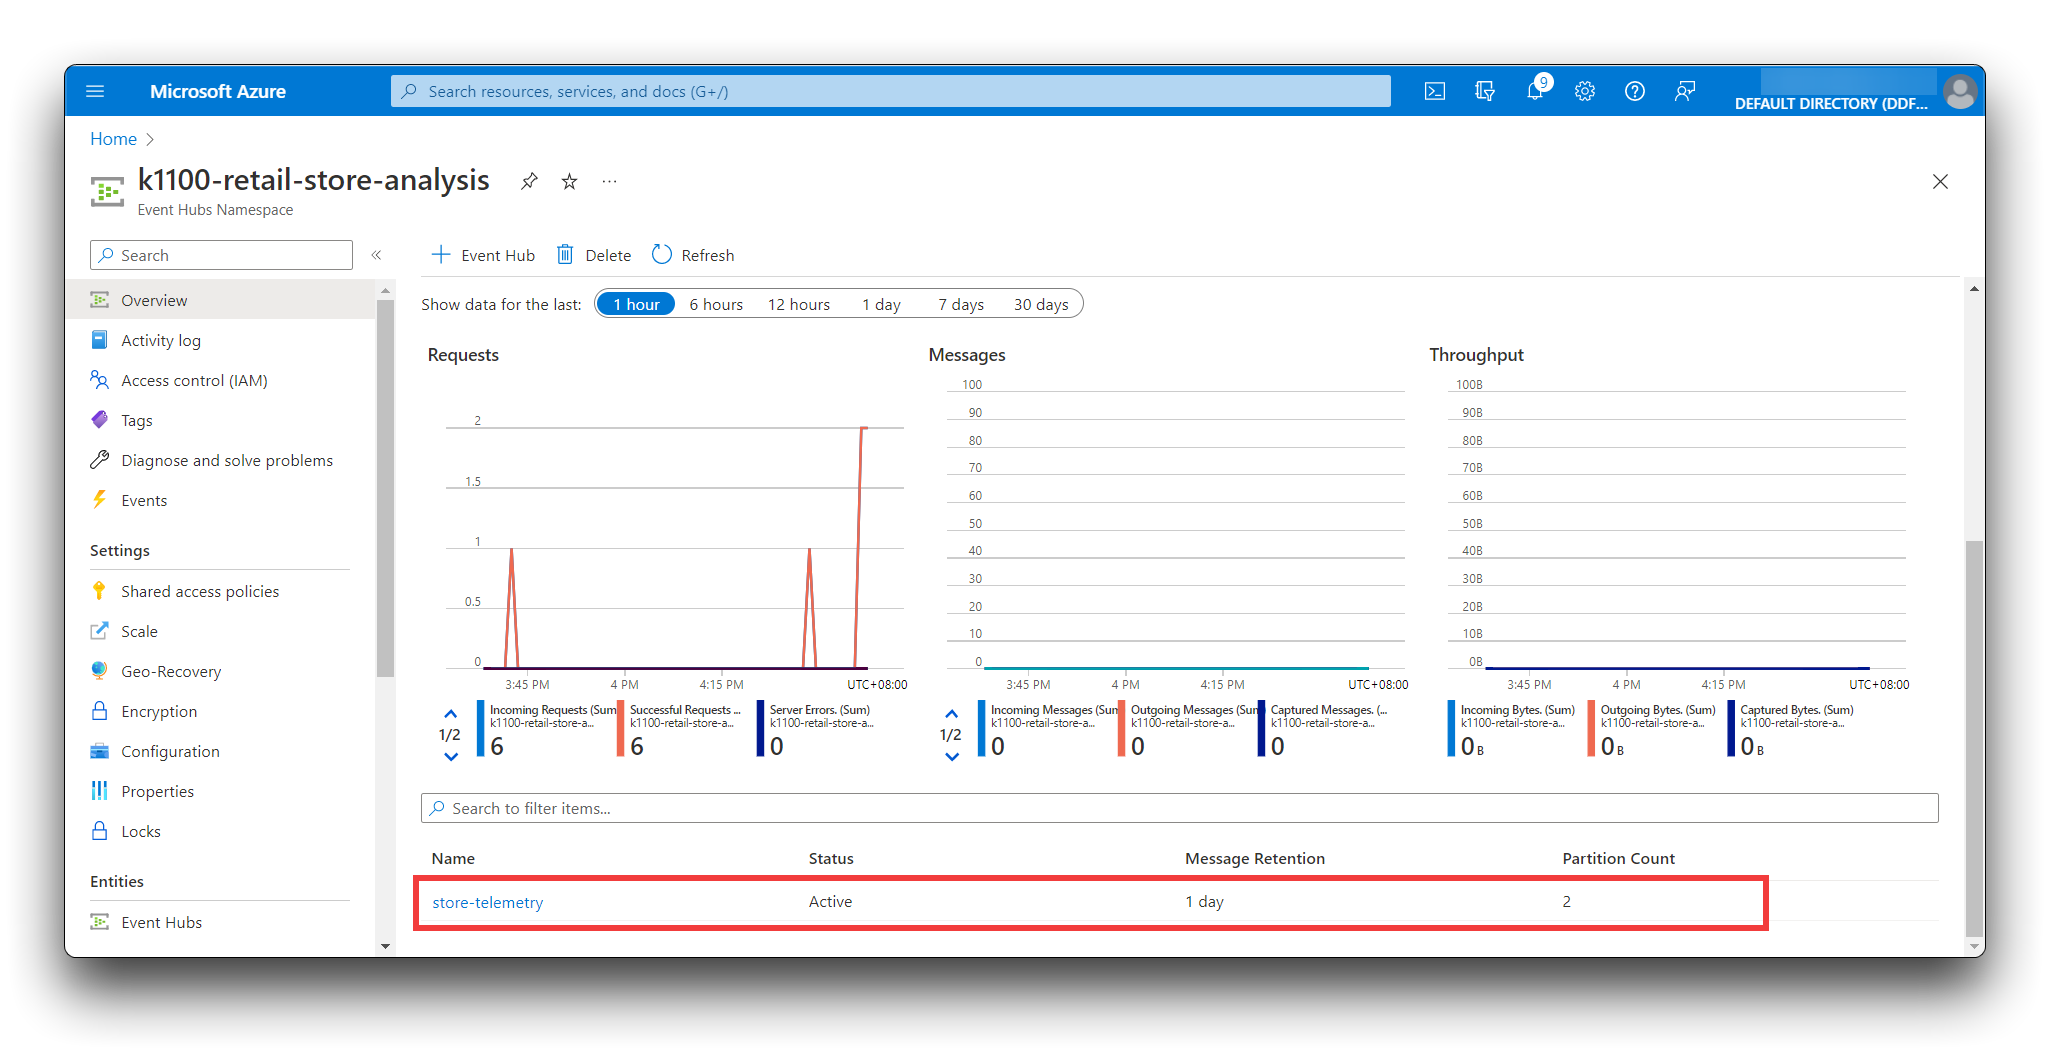
- On the Create Event Hub page, enter **store-telemetry** as the name, and then select **Create**.
You now have an event hub you can use when you configure data export from your IoT Central application.
## Configure data export
Now you have an event hub, you can configure your IoT Central Application to export telemetry from the connected devices. The following steps show you how to configure the export.
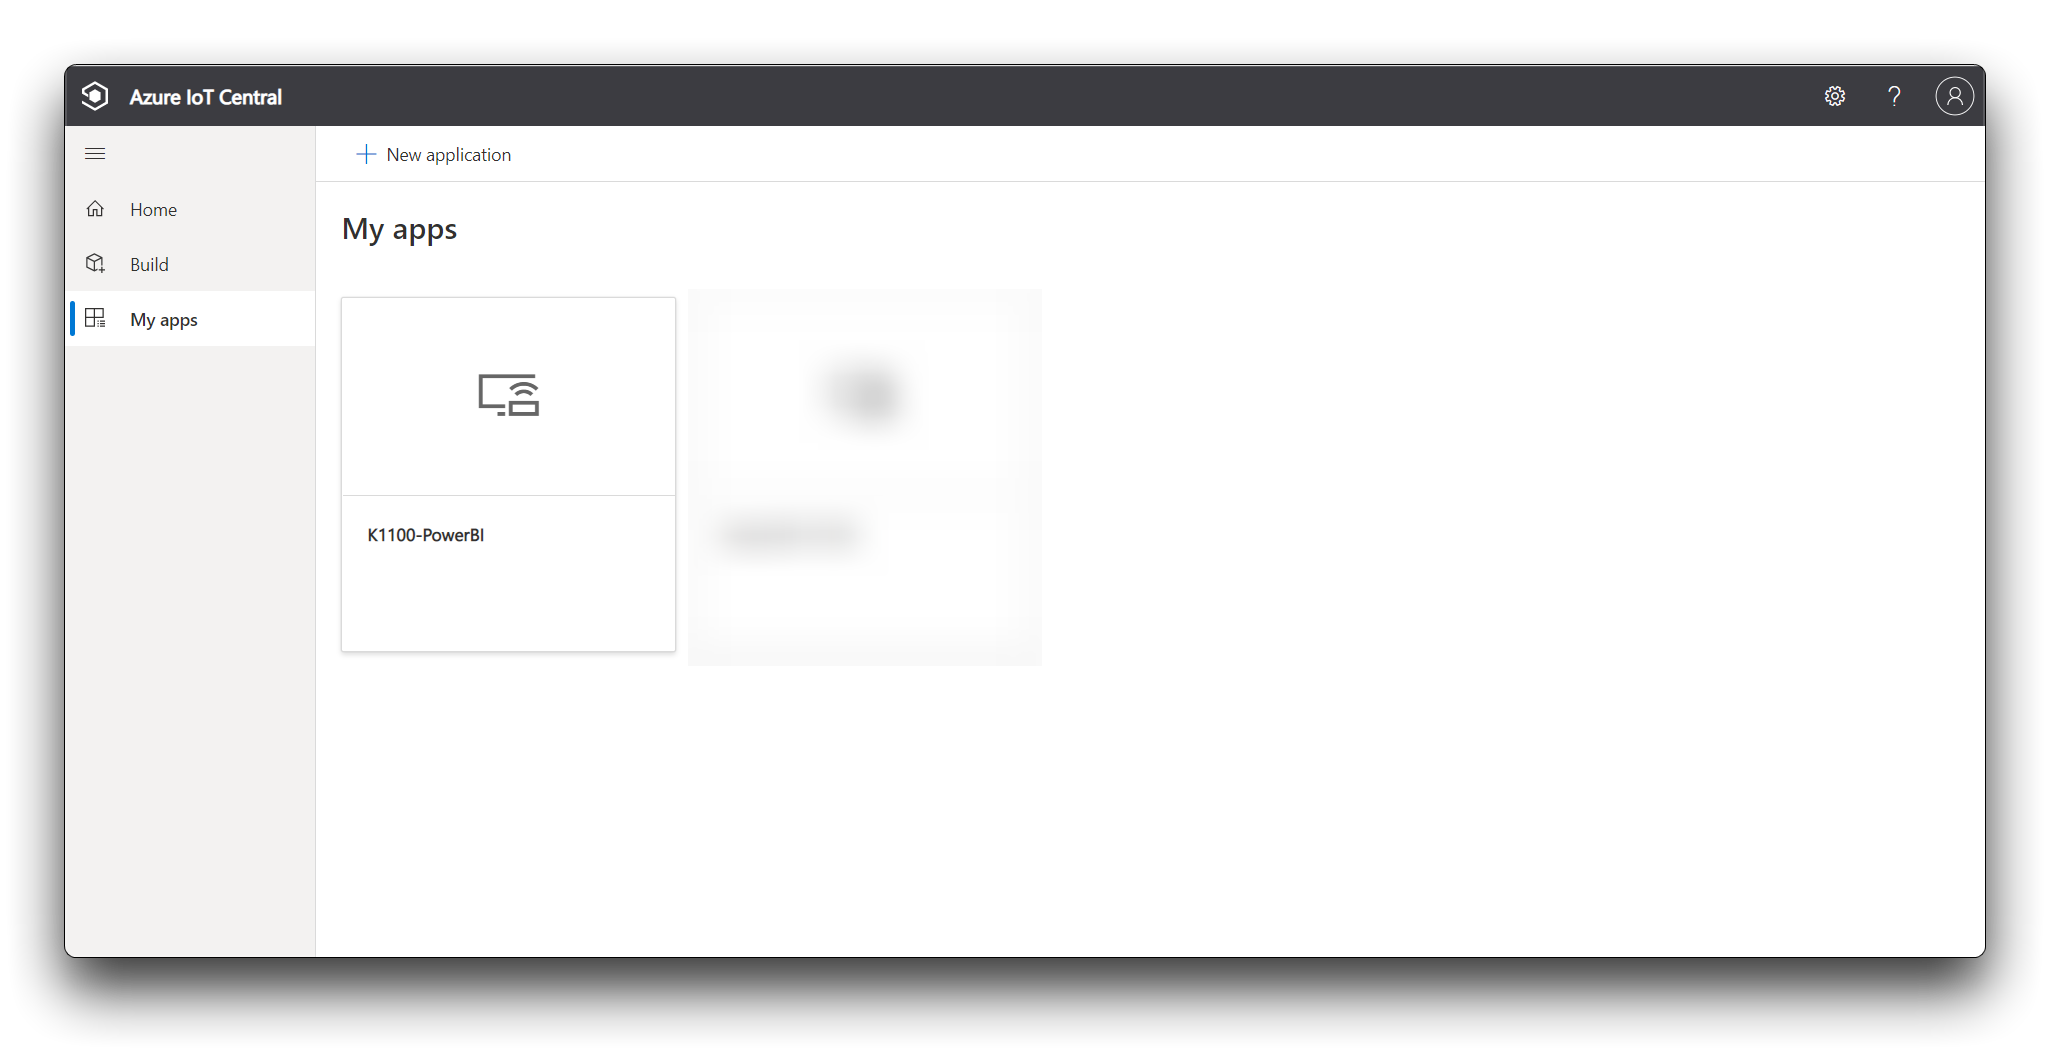
**Step 1.** Sign in to your [IoT Central Application](https://apps.azureiotcentral.com/home).
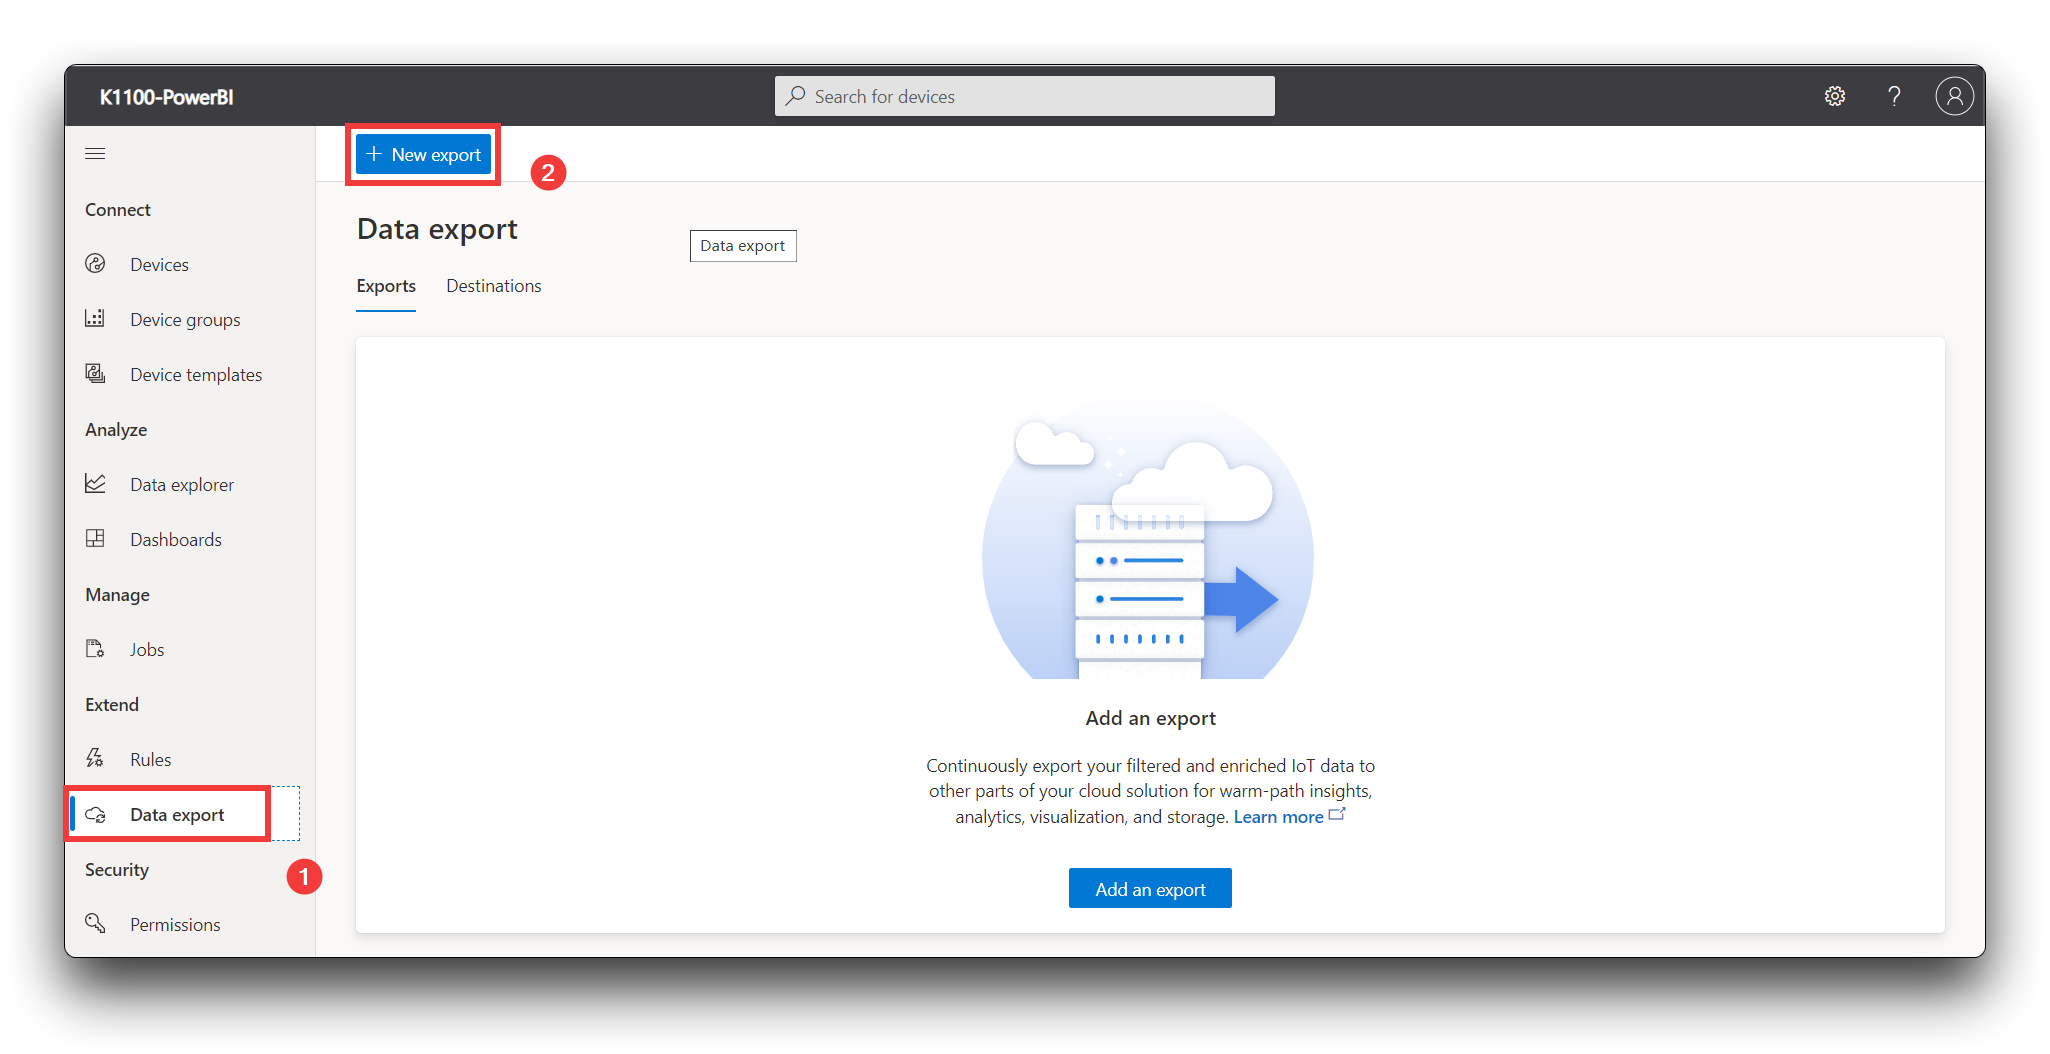
**Step 2.** Data export
Select **Data export** in the left pane. Select **+ New export**.
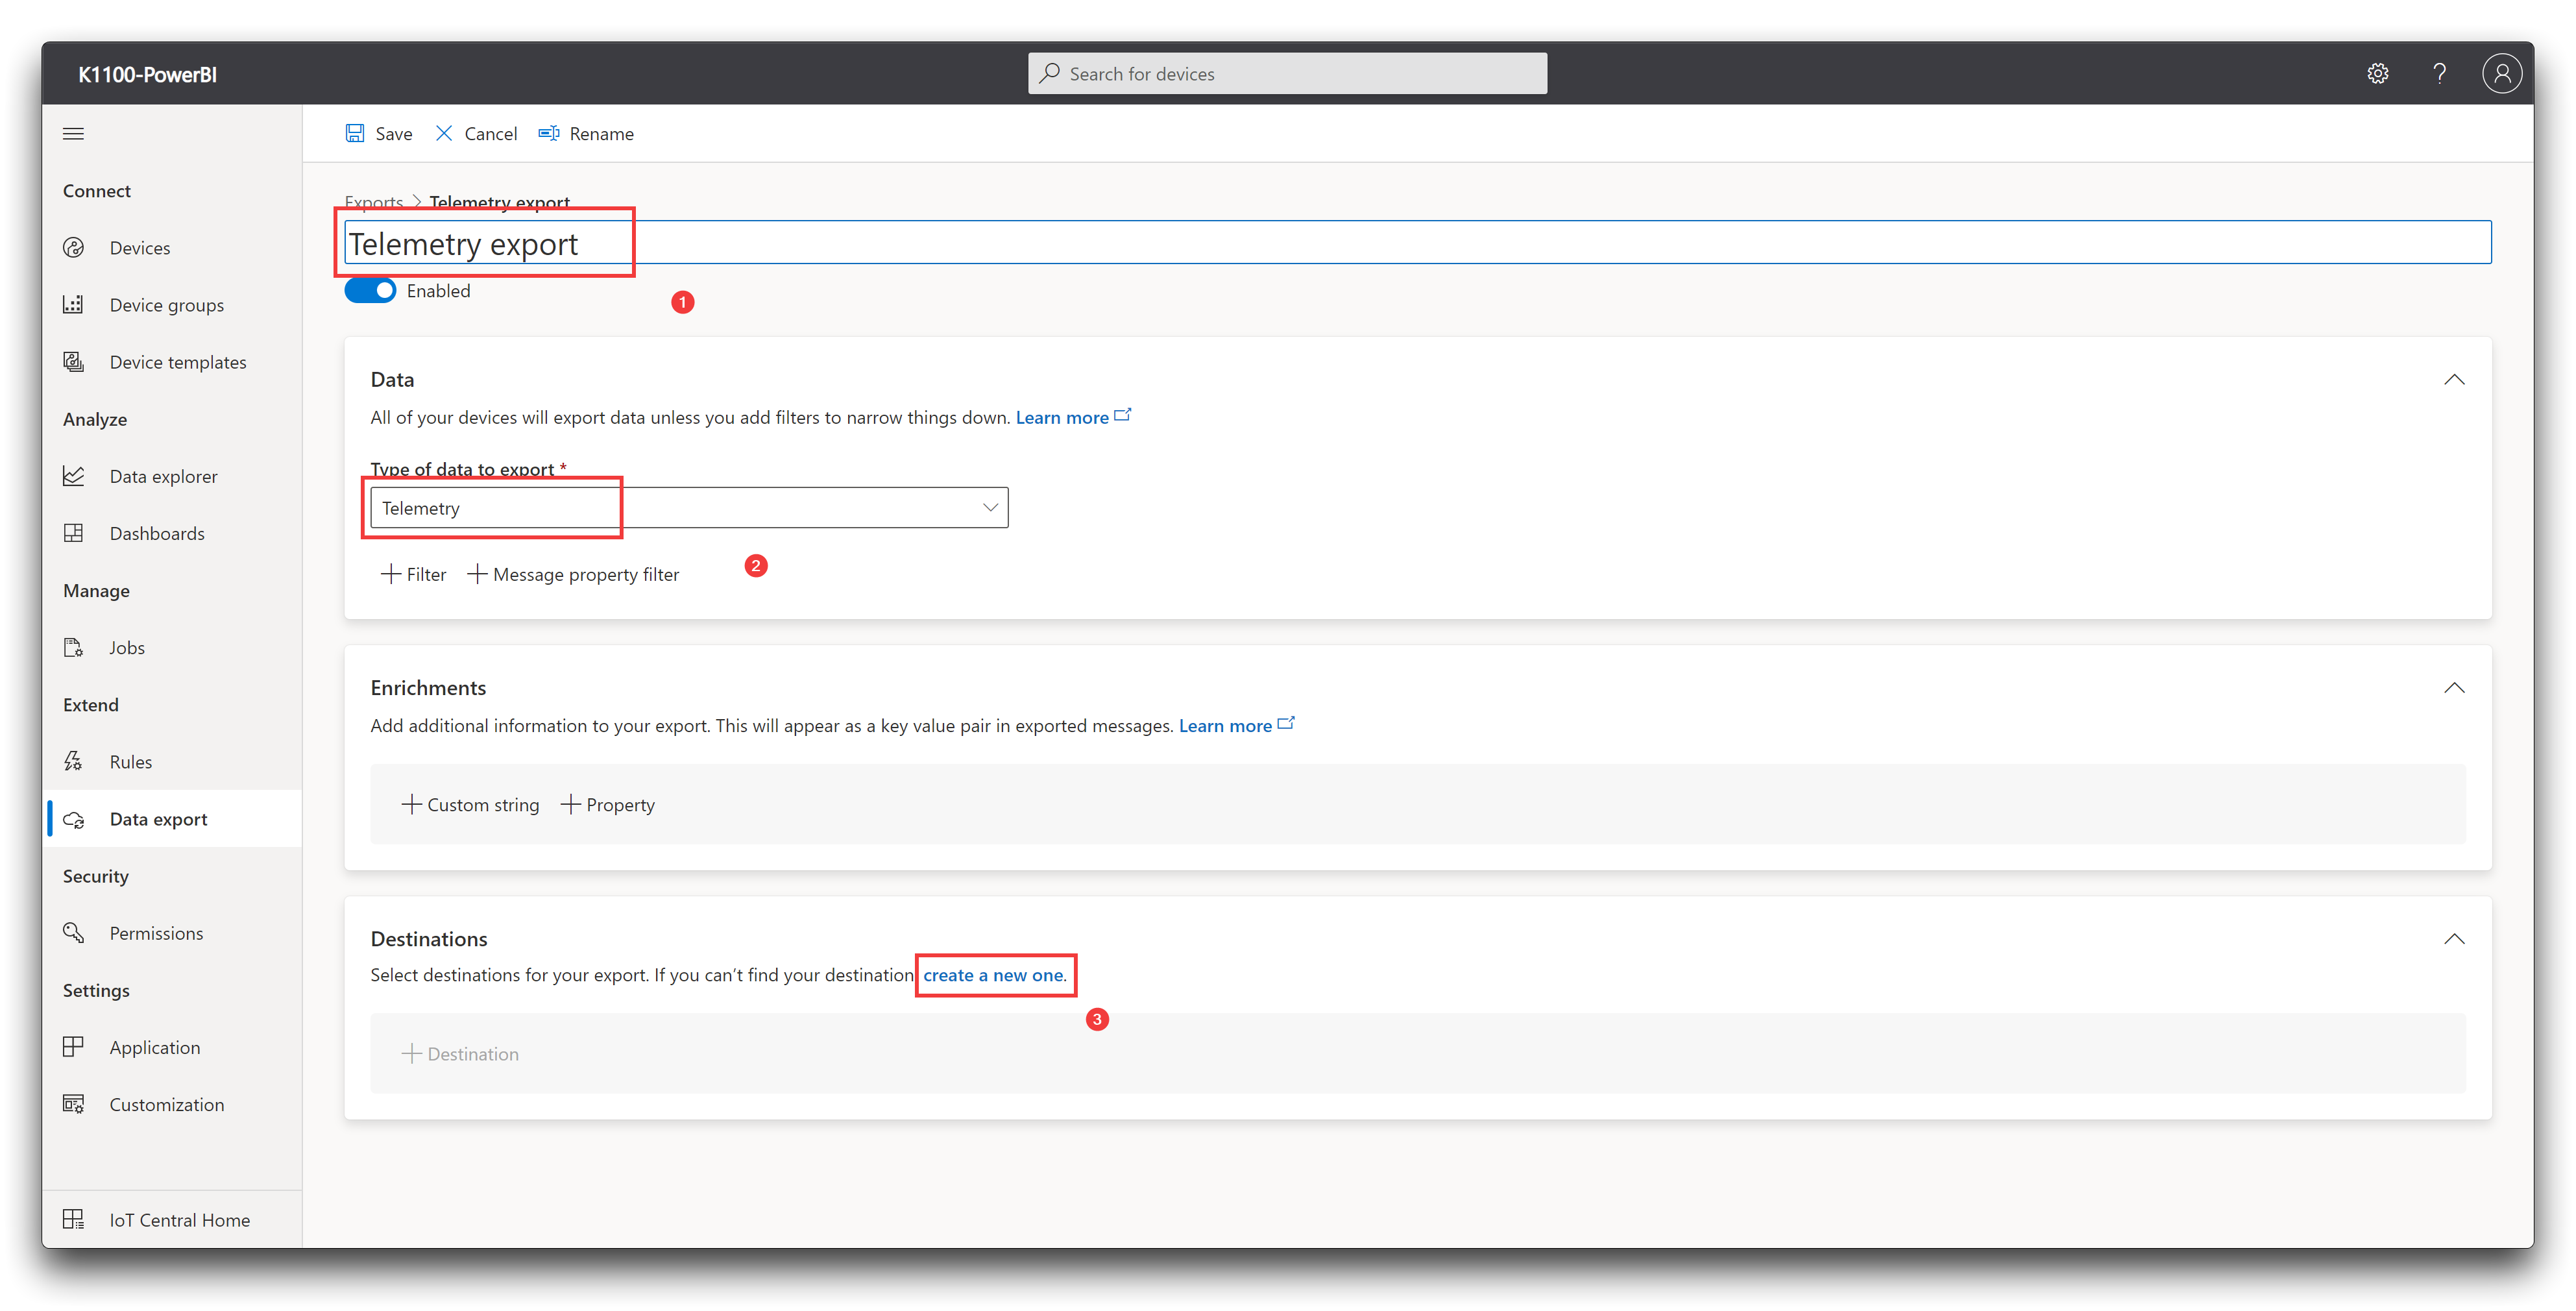
- Enter **Telemetry export** as the export name.
- Select **Telemetry** as type of data to export.
- In the Destinations section, select **create a new one**.
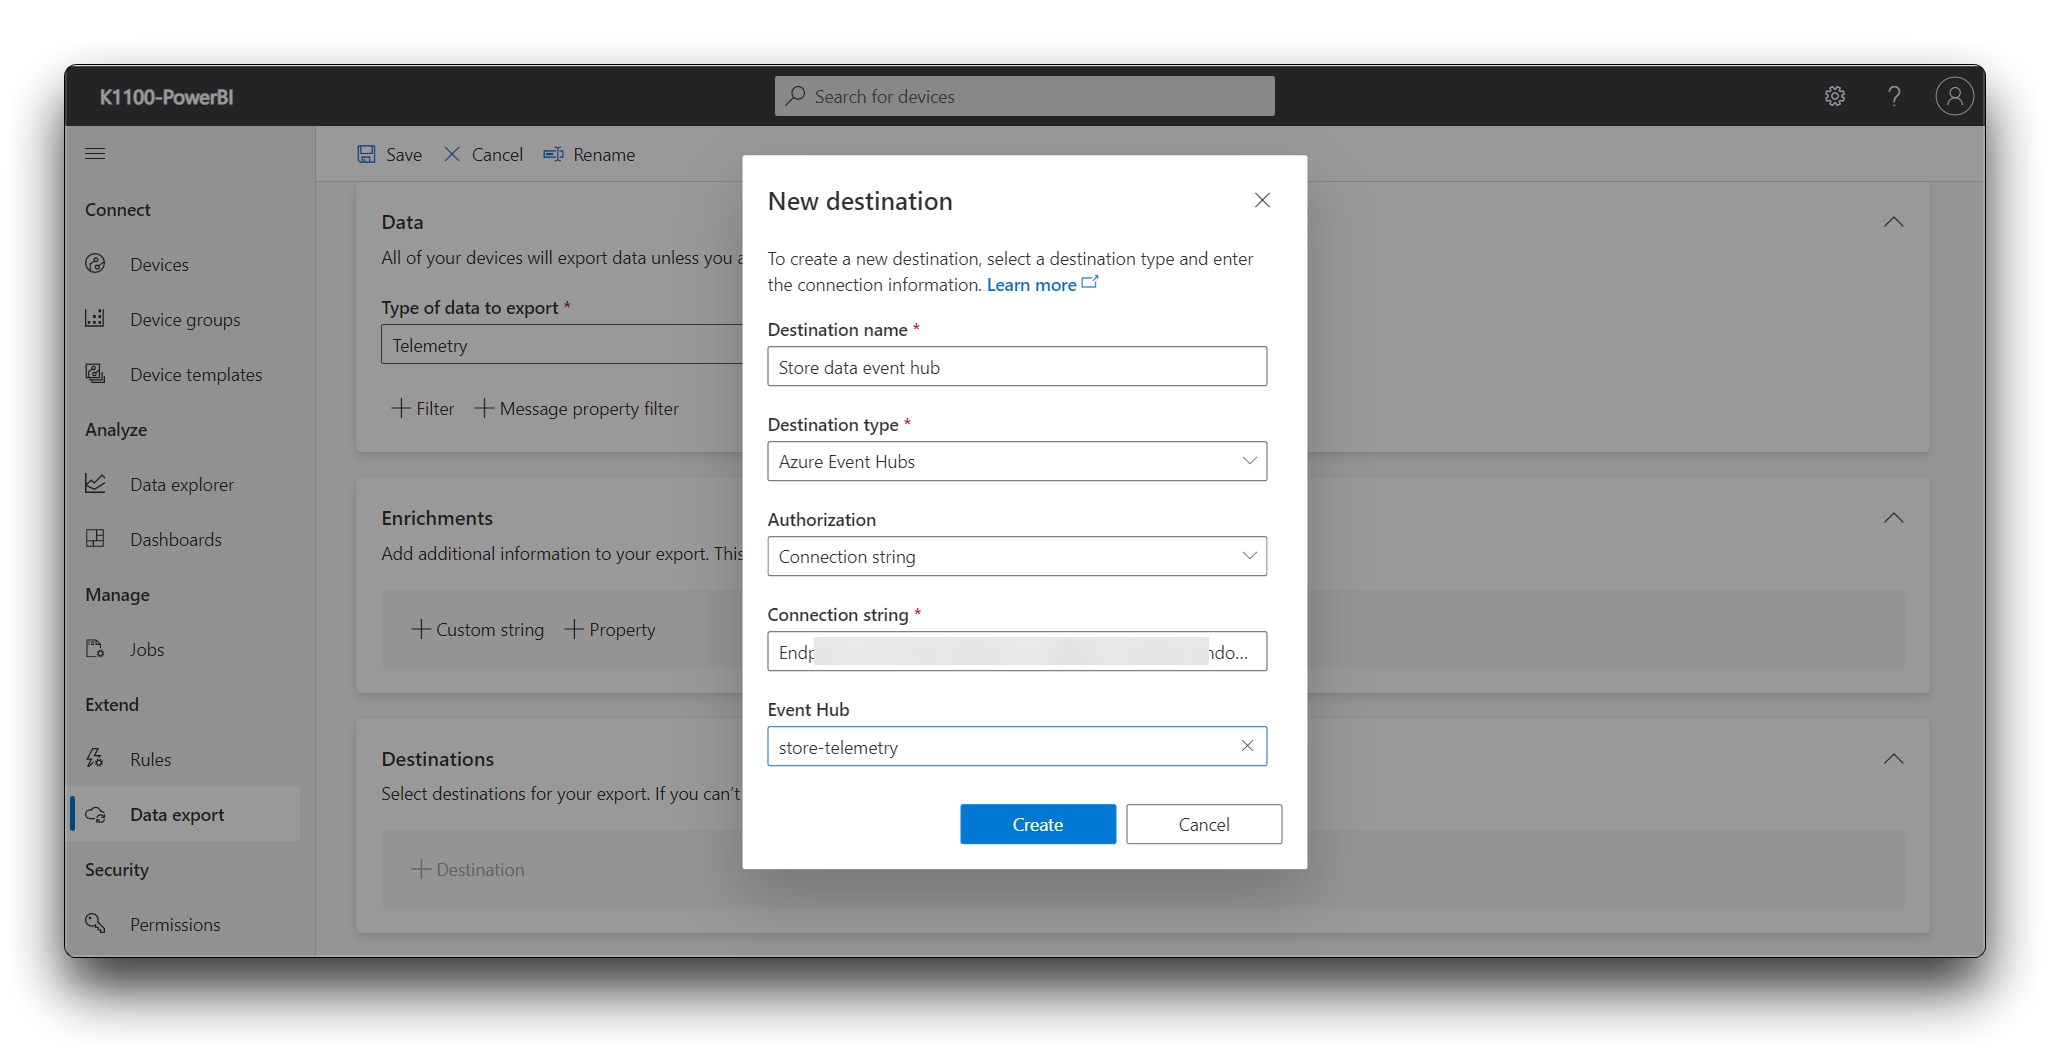
- New destination
- Enter **Store data event hub** as the **Destination name**.
- Select **Azure Event Hubs** as the **Destination type**.
- Select **Connection string** as the **Authorization**.
- Paste in the connection string for the **SendPolicy** you saved when you create the event hub.
- Enter store-telemetry as the Event Hub.
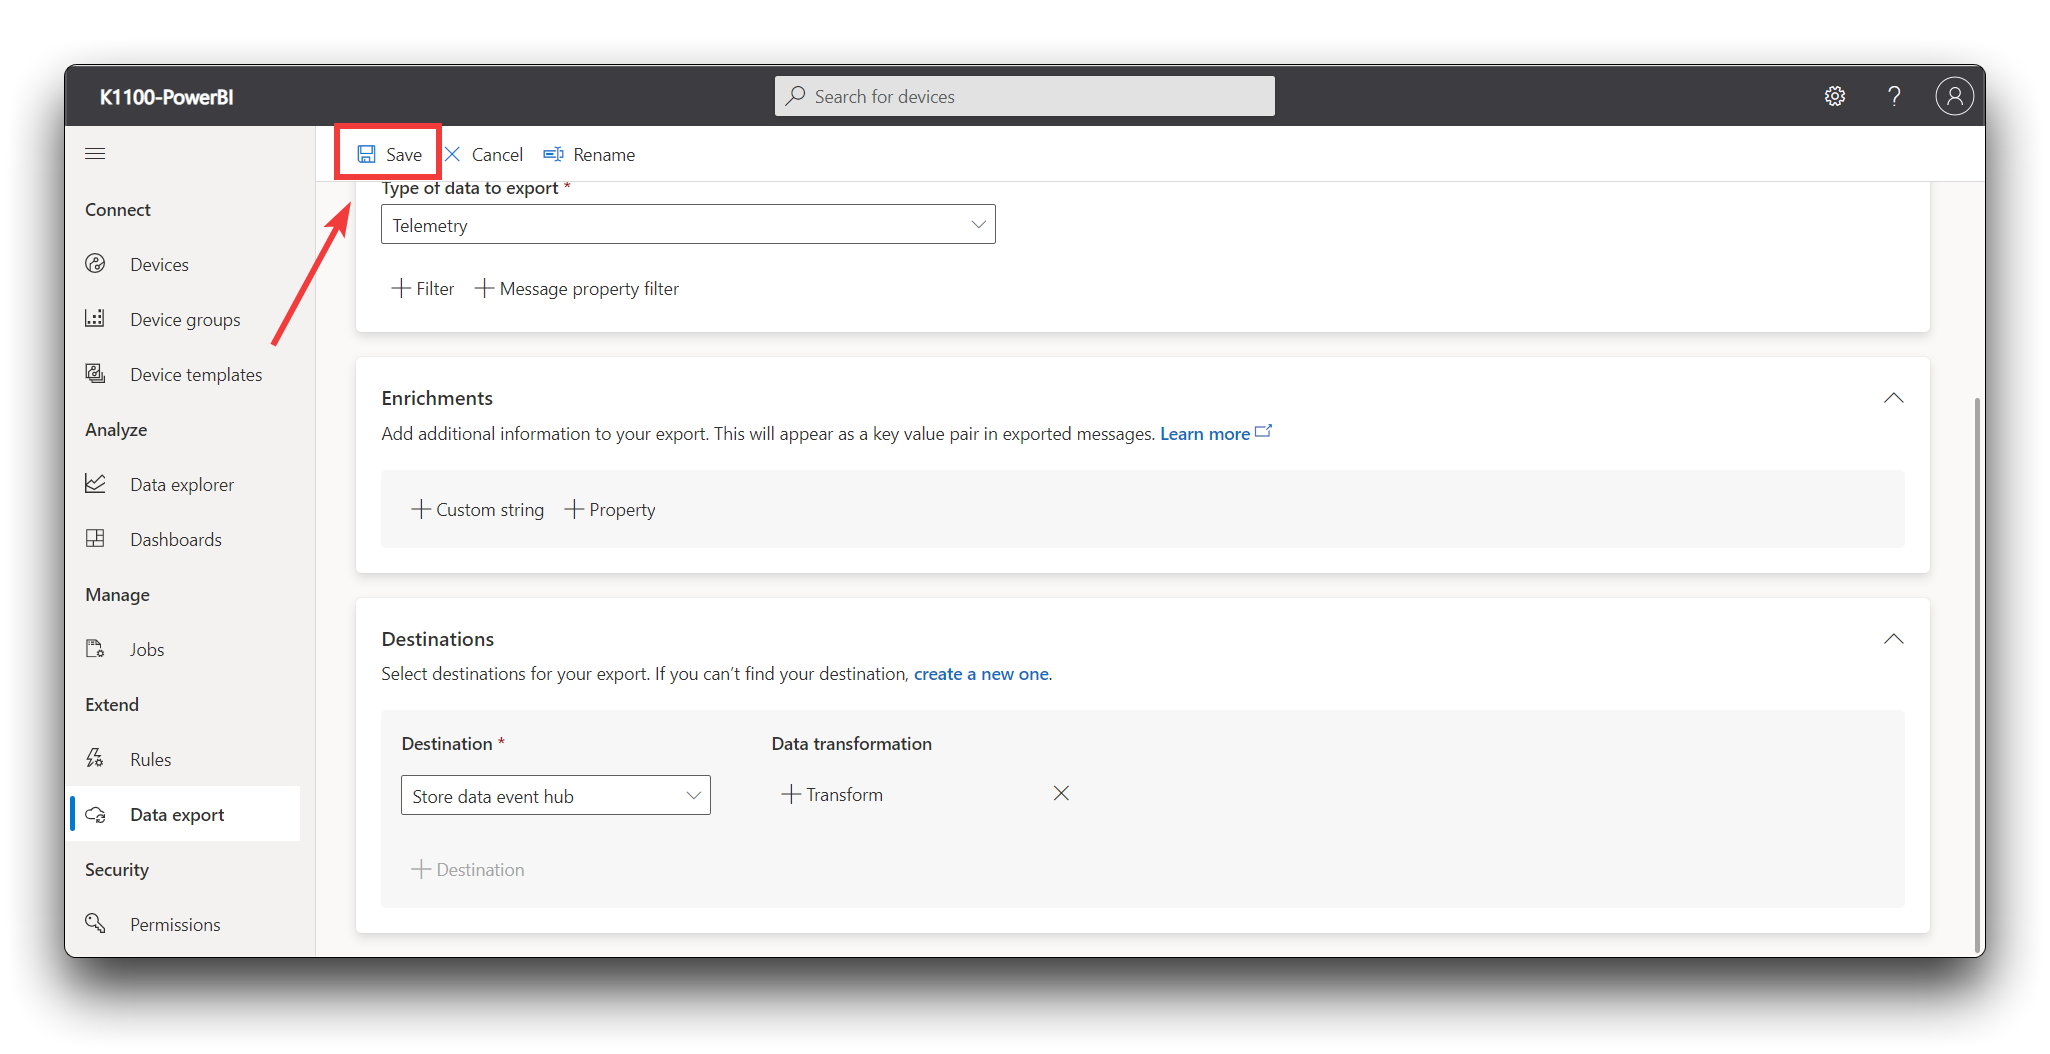
Select **Create** and then **Save**.
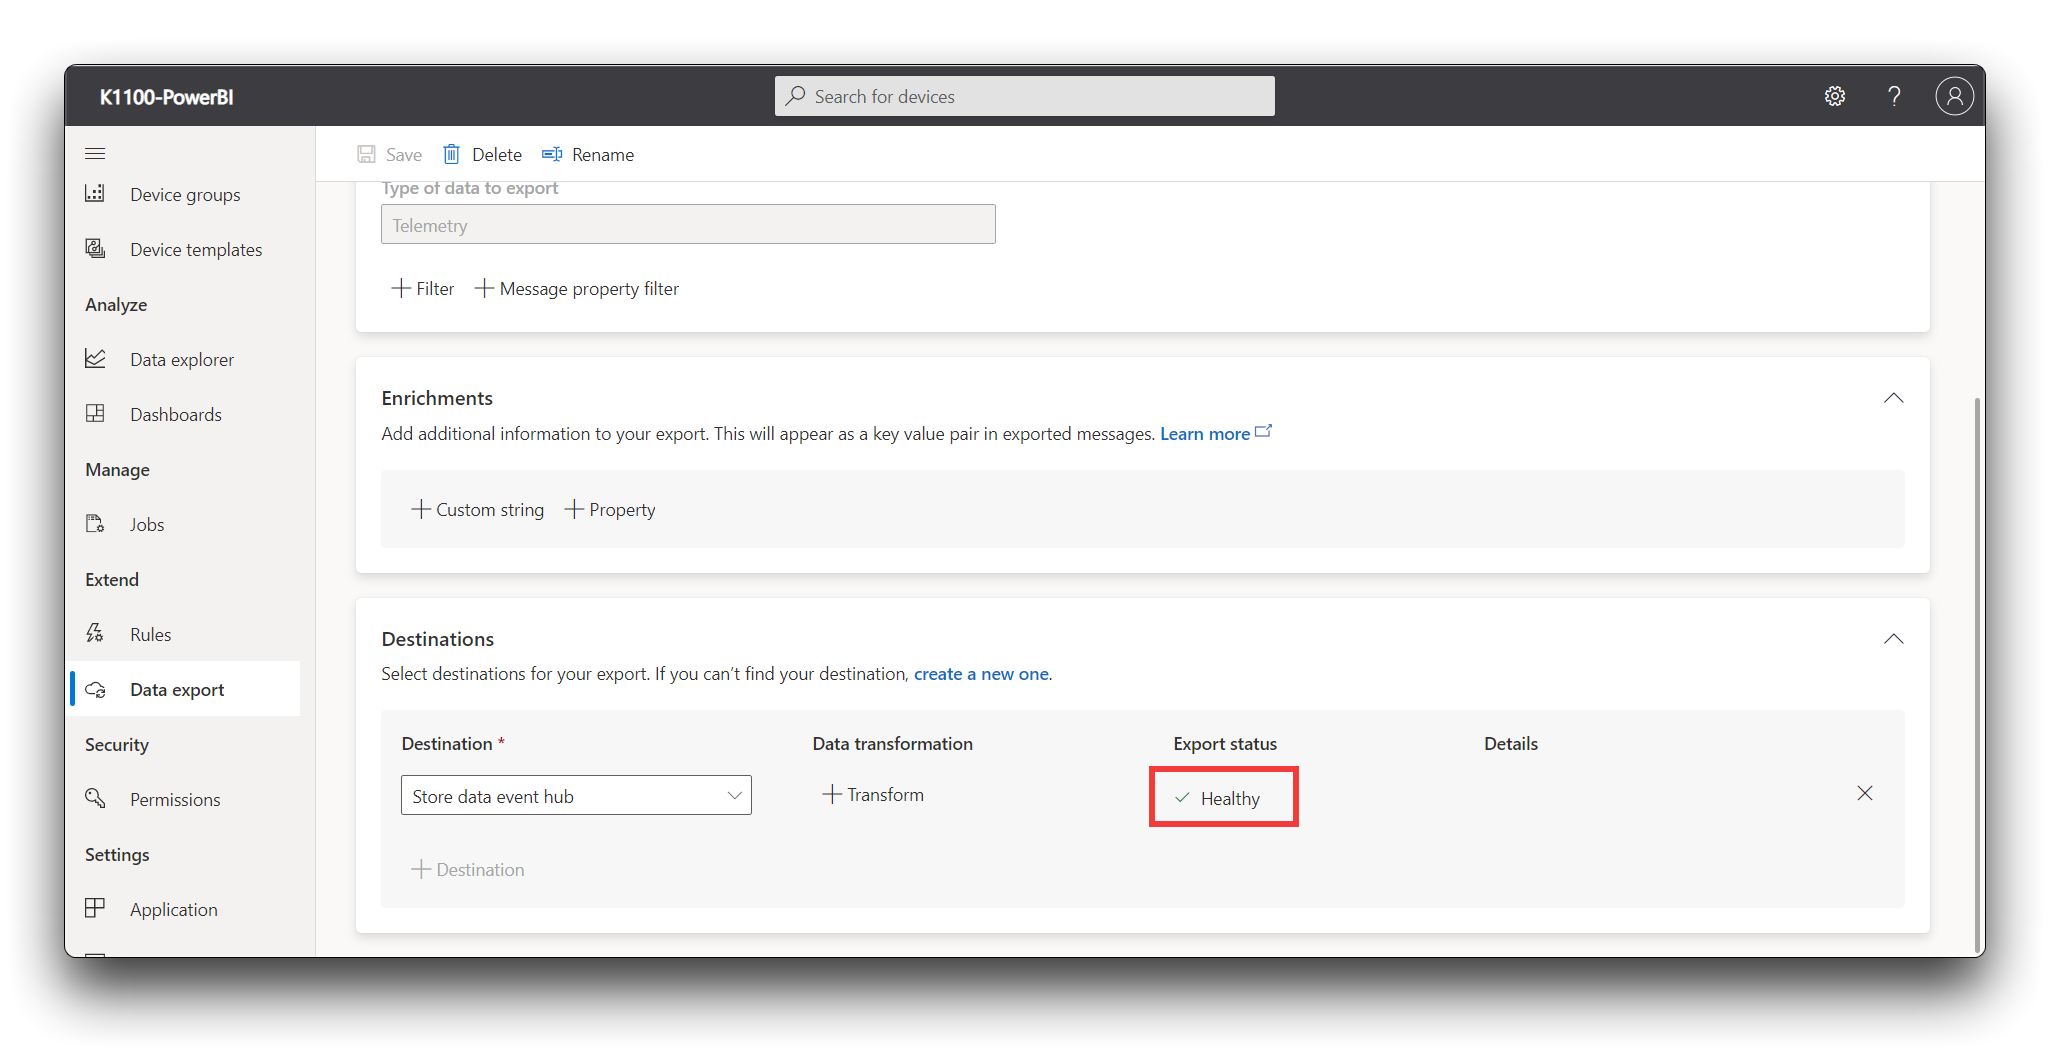
On the Telemetry export page, wait for the export status to change to Healthy.
The data export may take a few minutes to start sending telemetry to your event hub. You can see the status of the export on the Data exports page.
## Create the Power BI datasets
Your Power BI dashboard will display data from your retail monitoring application. In this solution, you use Power BI streaming datasets as the data source for the Power BI dashboard. In this section, you define the schema of the streaming datasets so that the logic app can forward data from the event hub. The following steps show you how to create two streaming datasets for the environmental sensors and one streaming dataset for the occupancy sensor:
**Step 1.** Sign in to your [Power BI account](https://app.powerbi.com/).
**Step 2.** Create a workspace.
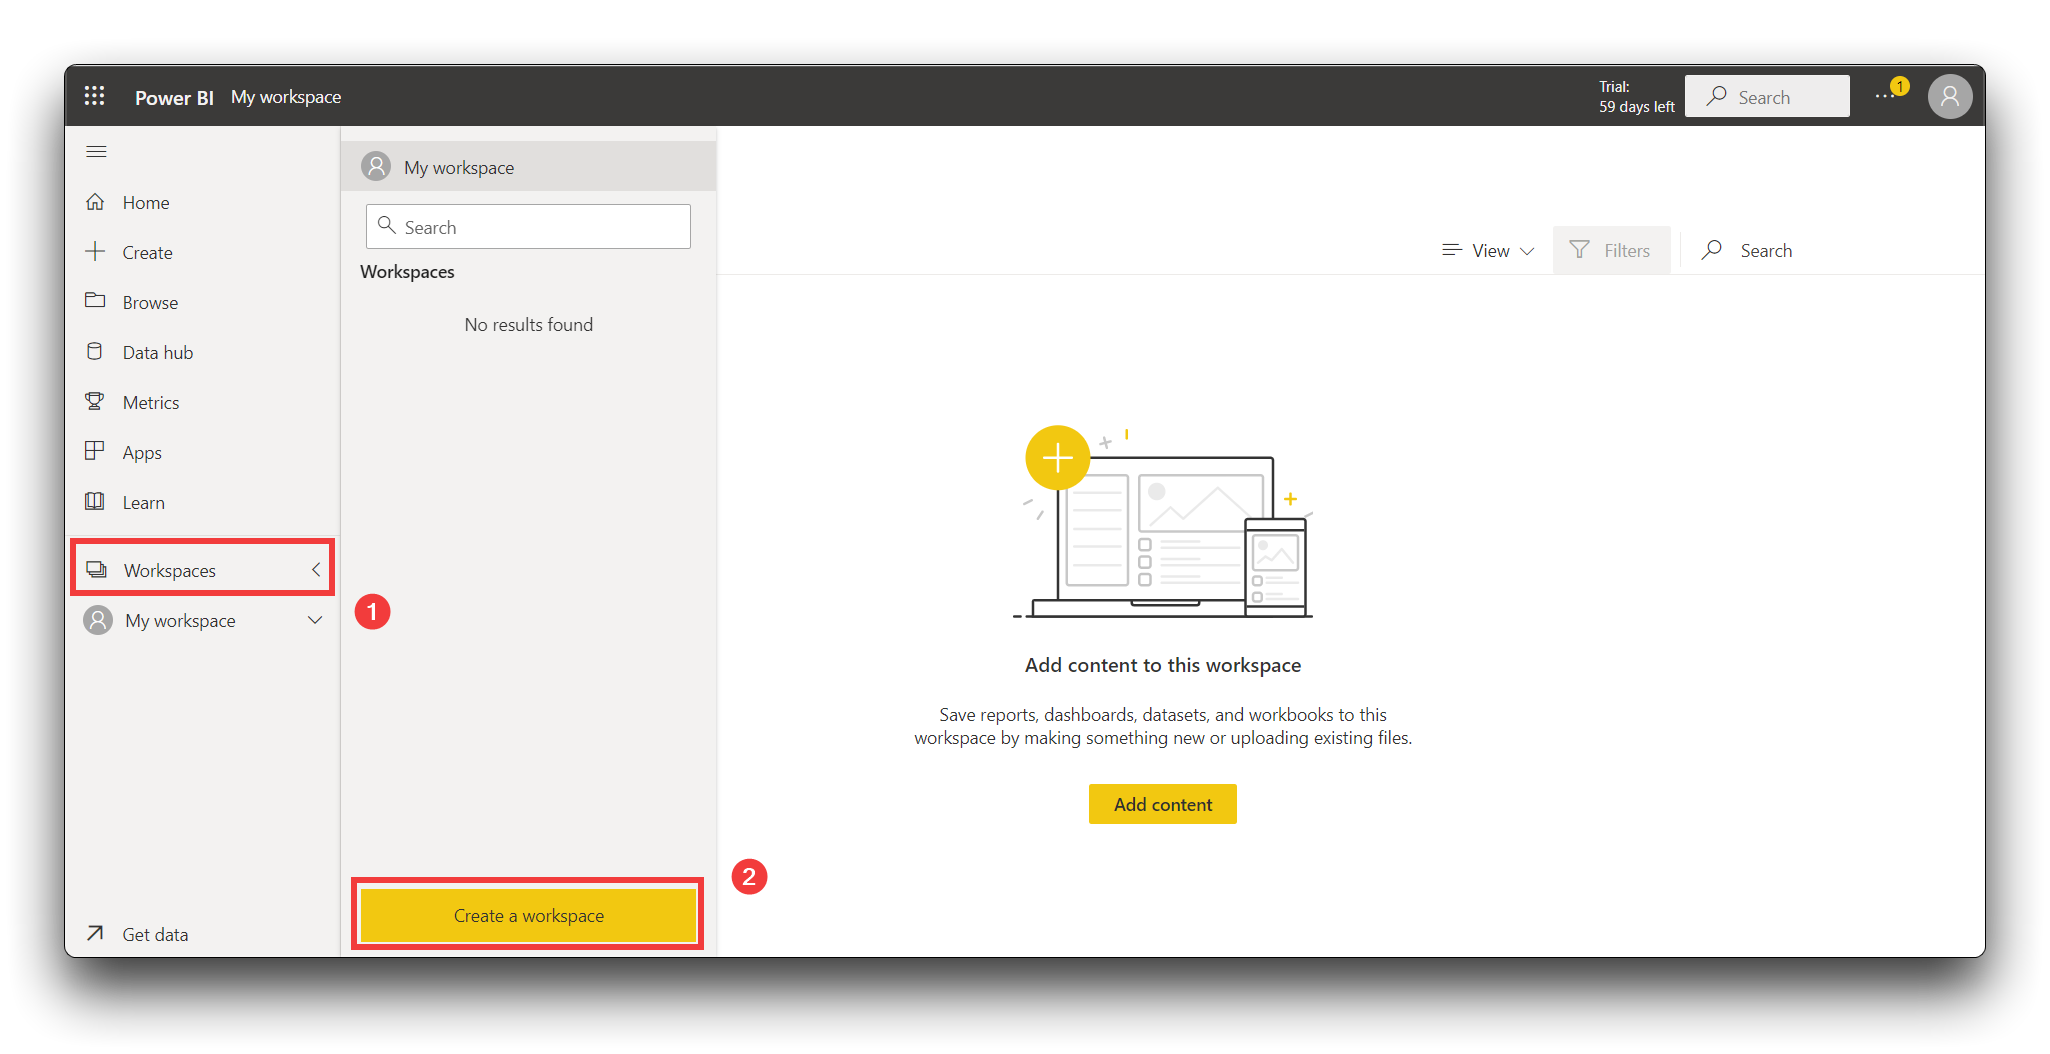
Select **Workspaces**, and then select **Create a workspace**.
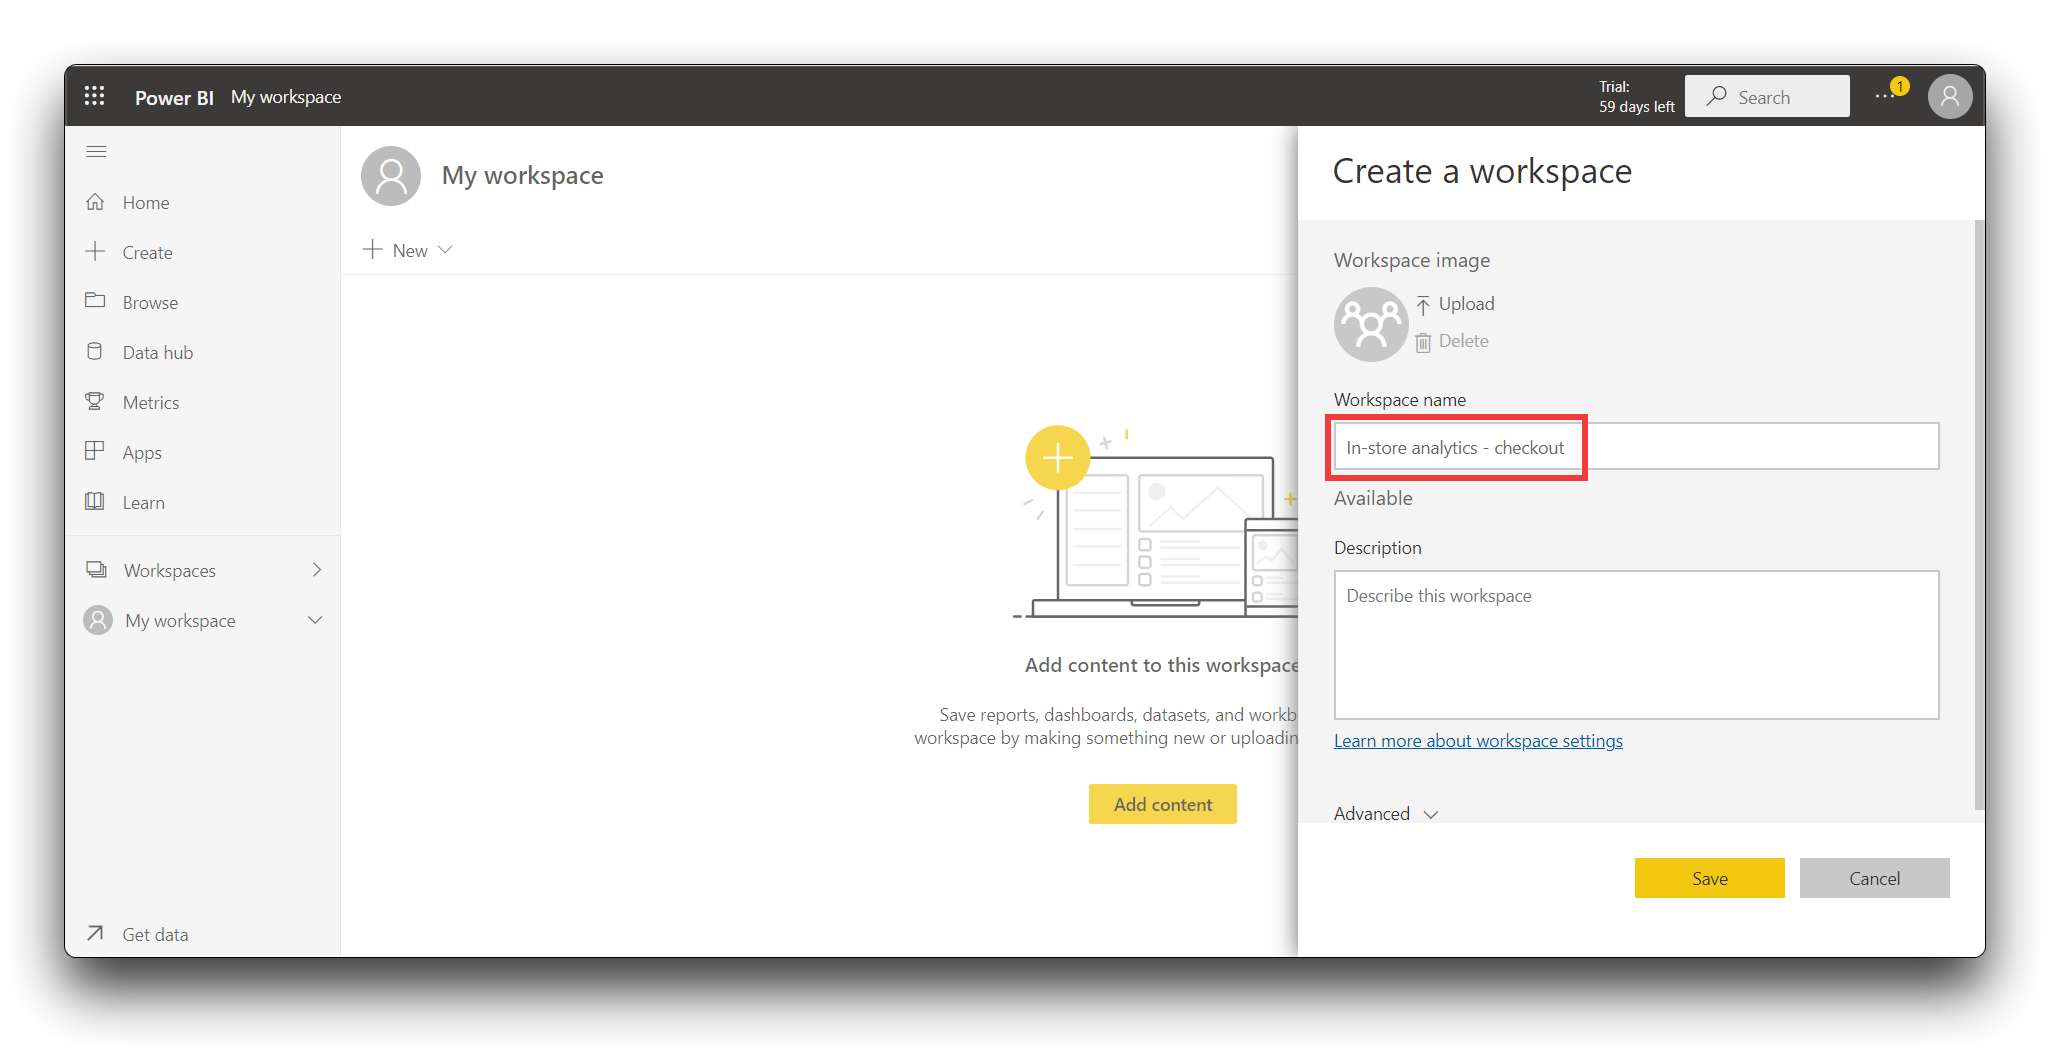
On the Create a workspace page, enter **In-store analytics - checkout** as the Workspace name. Select **Save**.
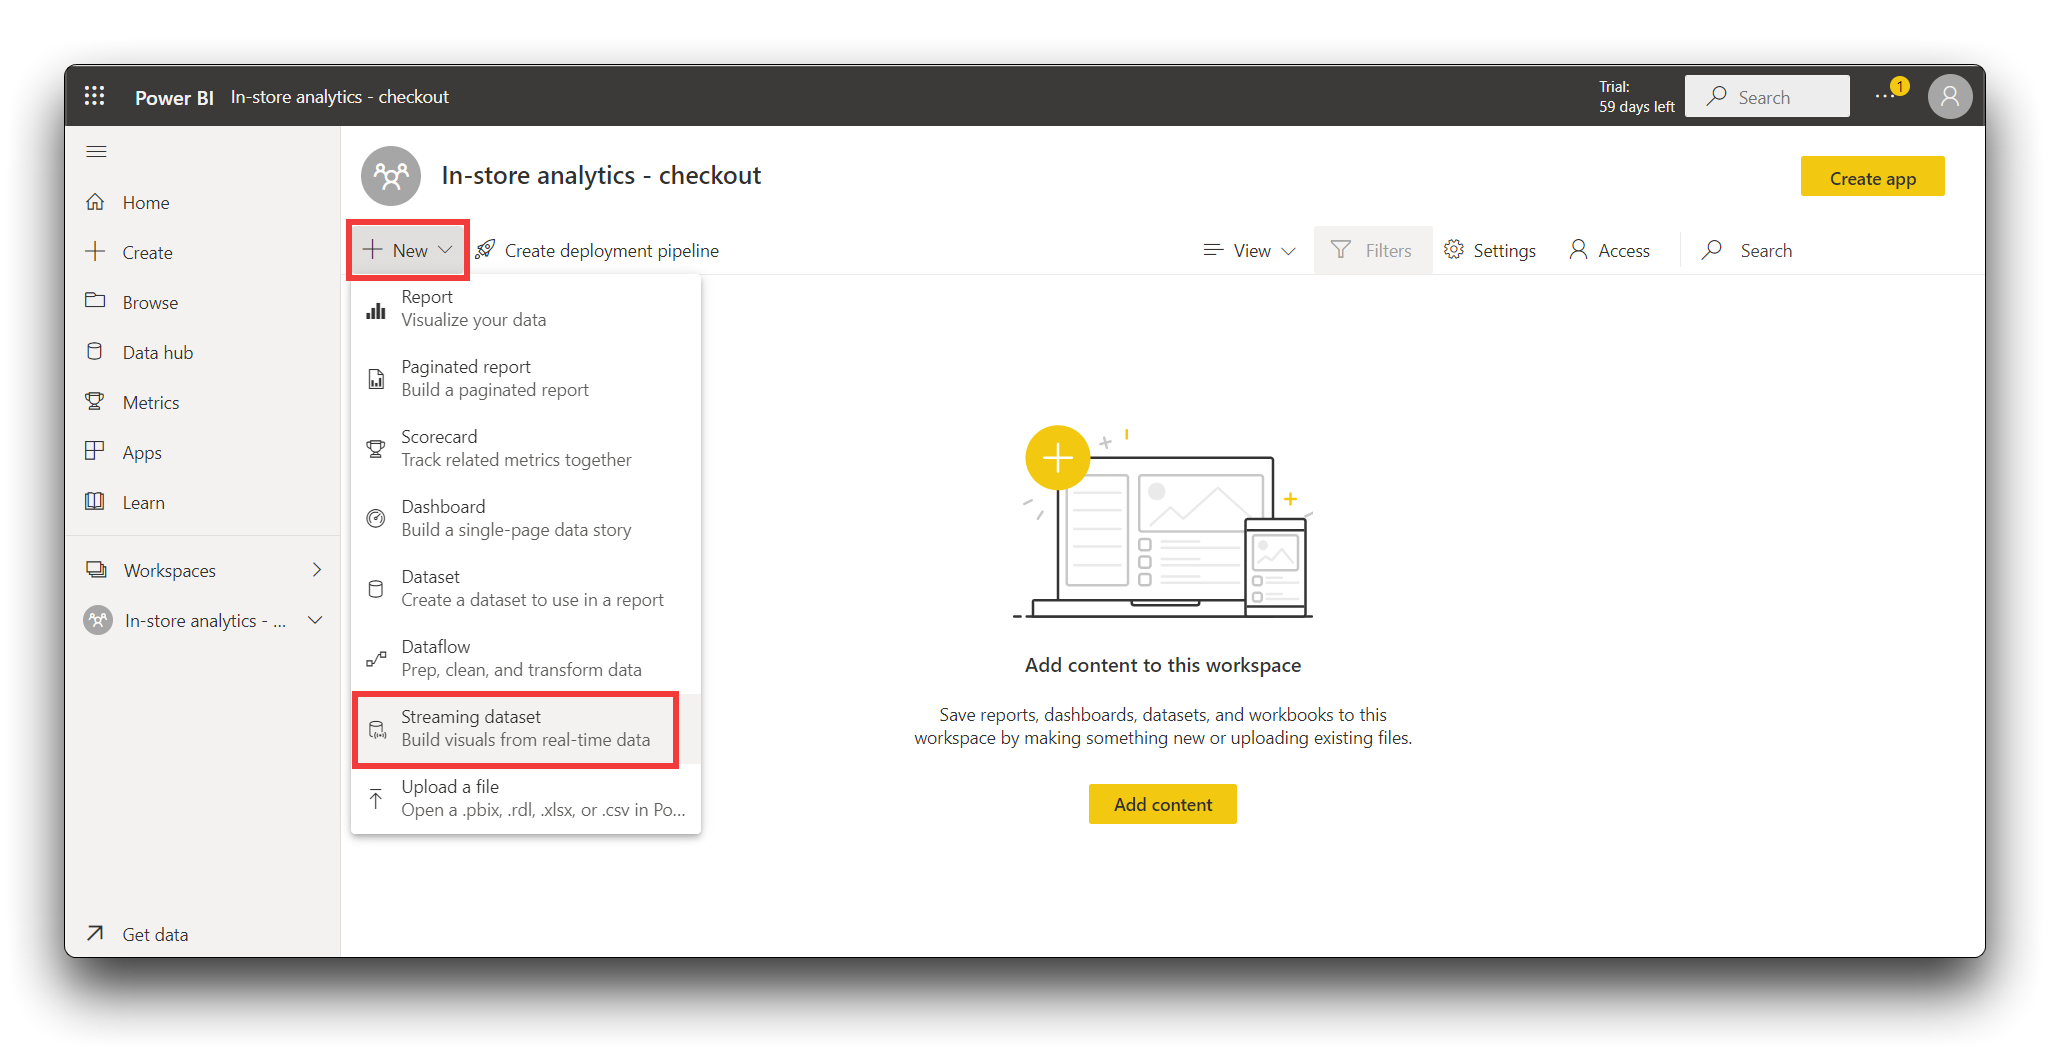
**Step 3.** Create a streaming dataset.
On the workspace page, select **+ New** > **Streaming dataset**.
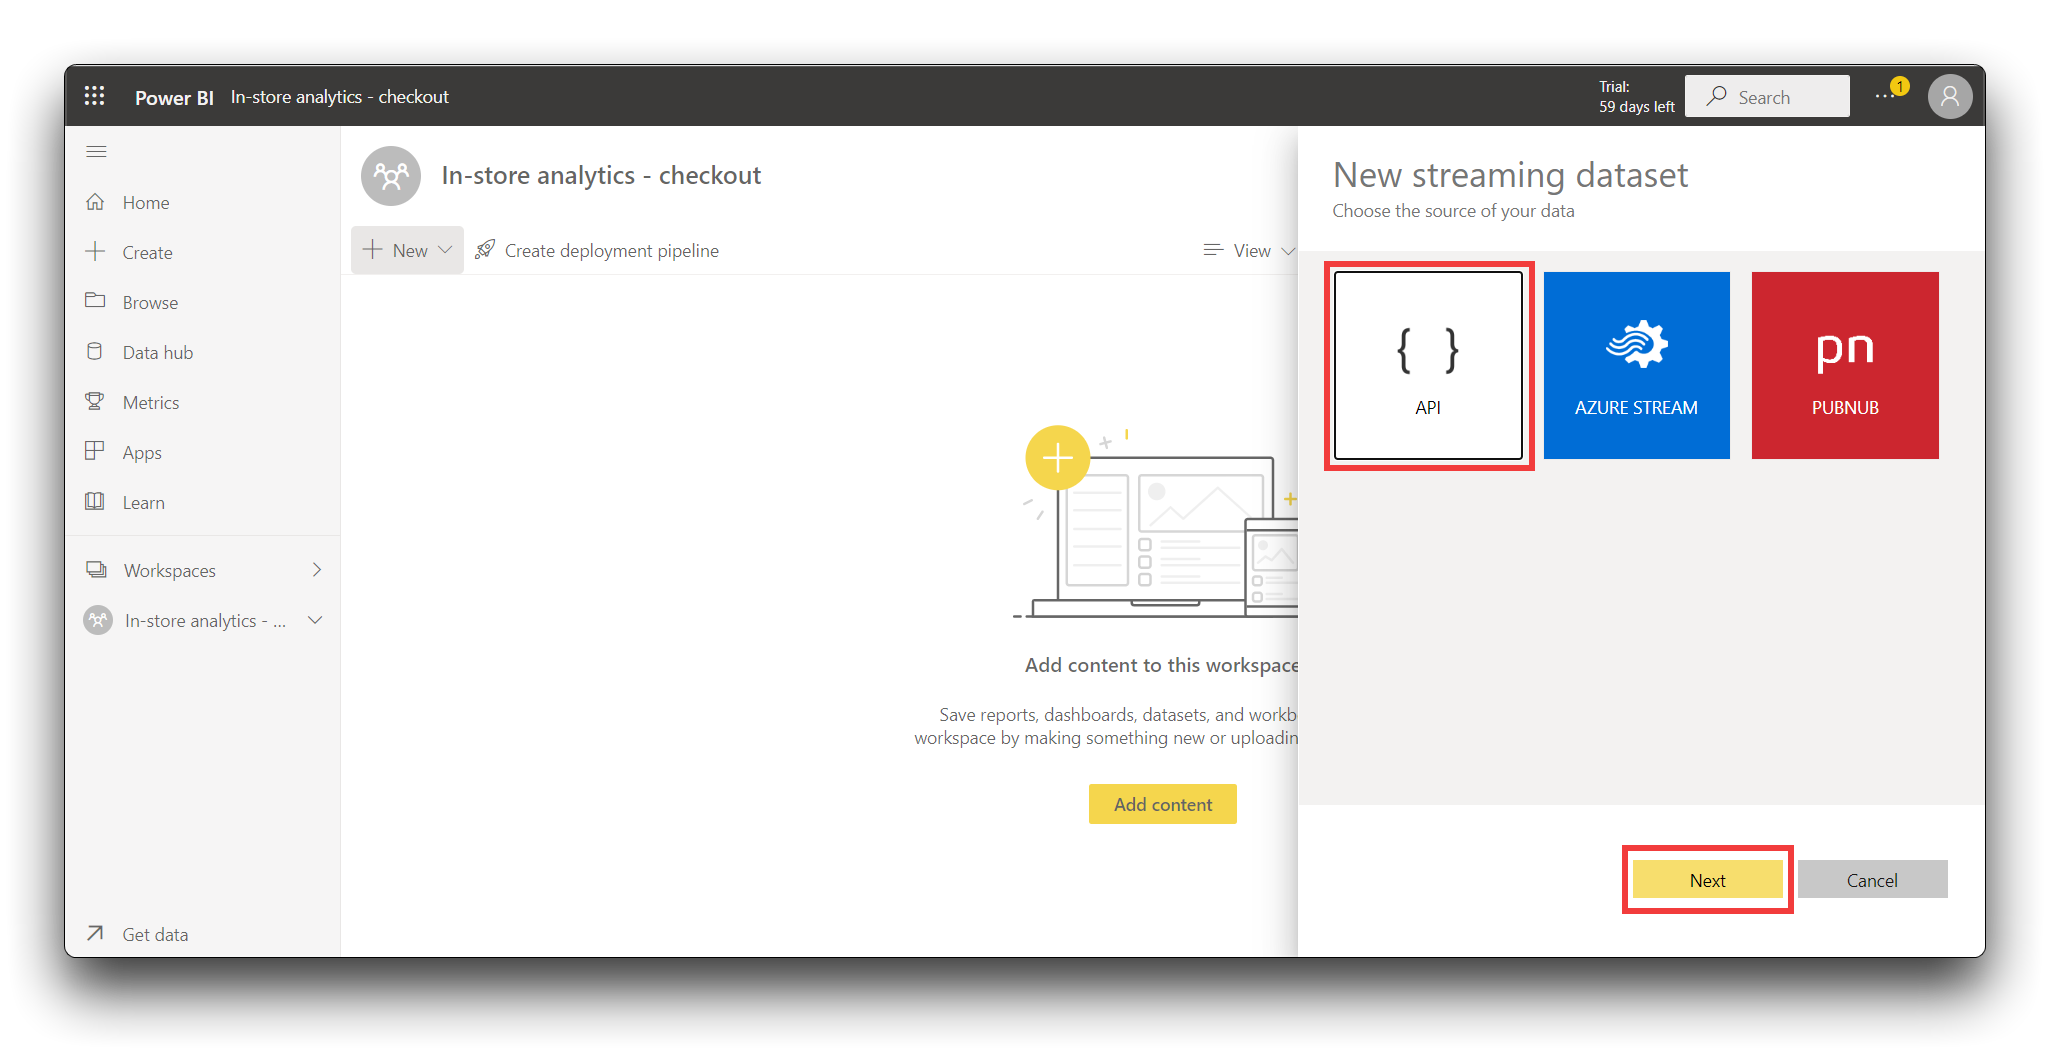
On the New streaming dataset page, choose API, and then select Next.
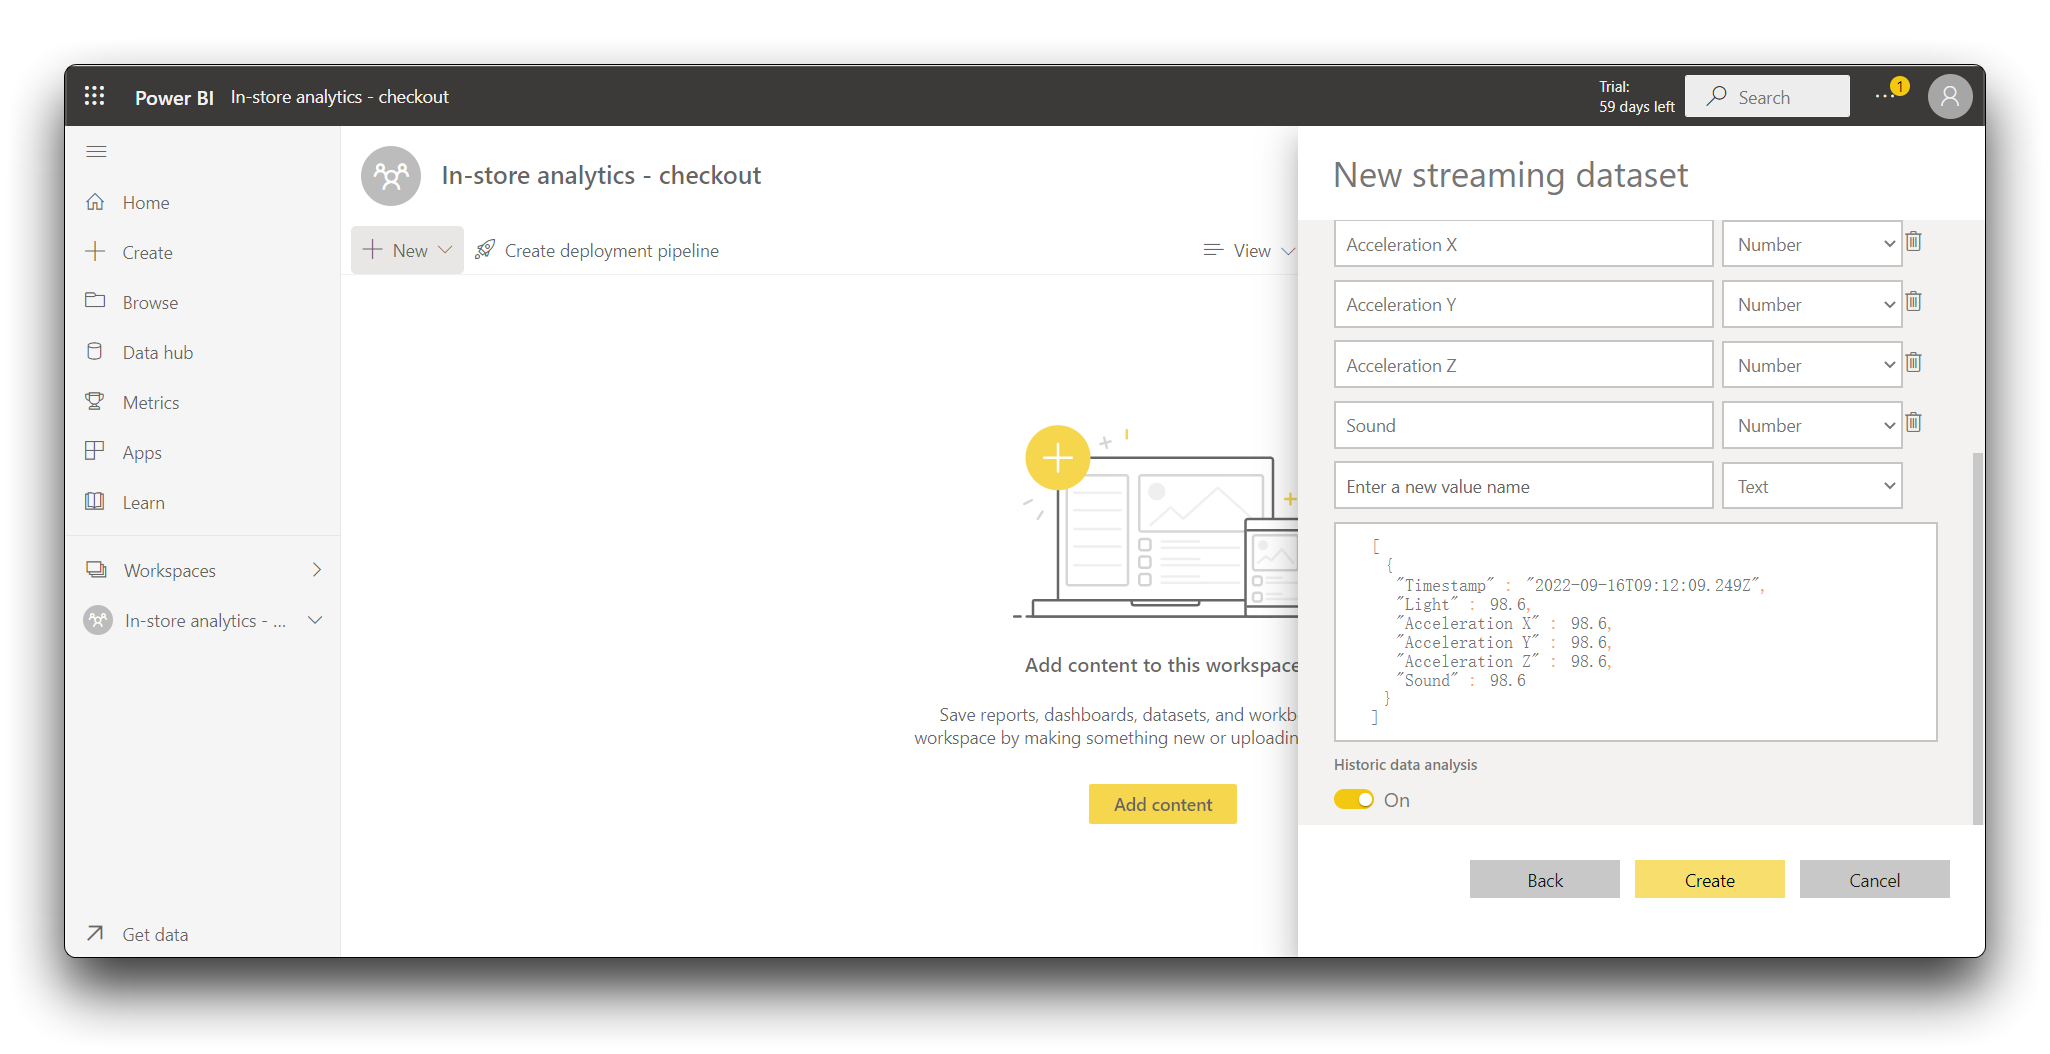
Enter **Sensor** as the Dataset name.
Enter the three Values from stream in following table:
| Value name | Value type |
|---------------------------|------------------------------|
| Timestamp | DataTime |
| Light | Number |
| Acceleration X | Number |
| Acceleration Y | Number |
| Acceleration Z | Number |
| Sound | Number |
You now have a streaming datasets. The logic app will route telemetry from the Wio Terminal connected to your In-store analytics - checkout application to the dataset.
## Create a logic app
In this solution, the logic app reads telemetry from the event hub, parses the data, and then sends it to the Power BI streaming datasets you created.
Before you create the logic app, you need the device ID of the Wio Terminal you connected to your IoT Central application.
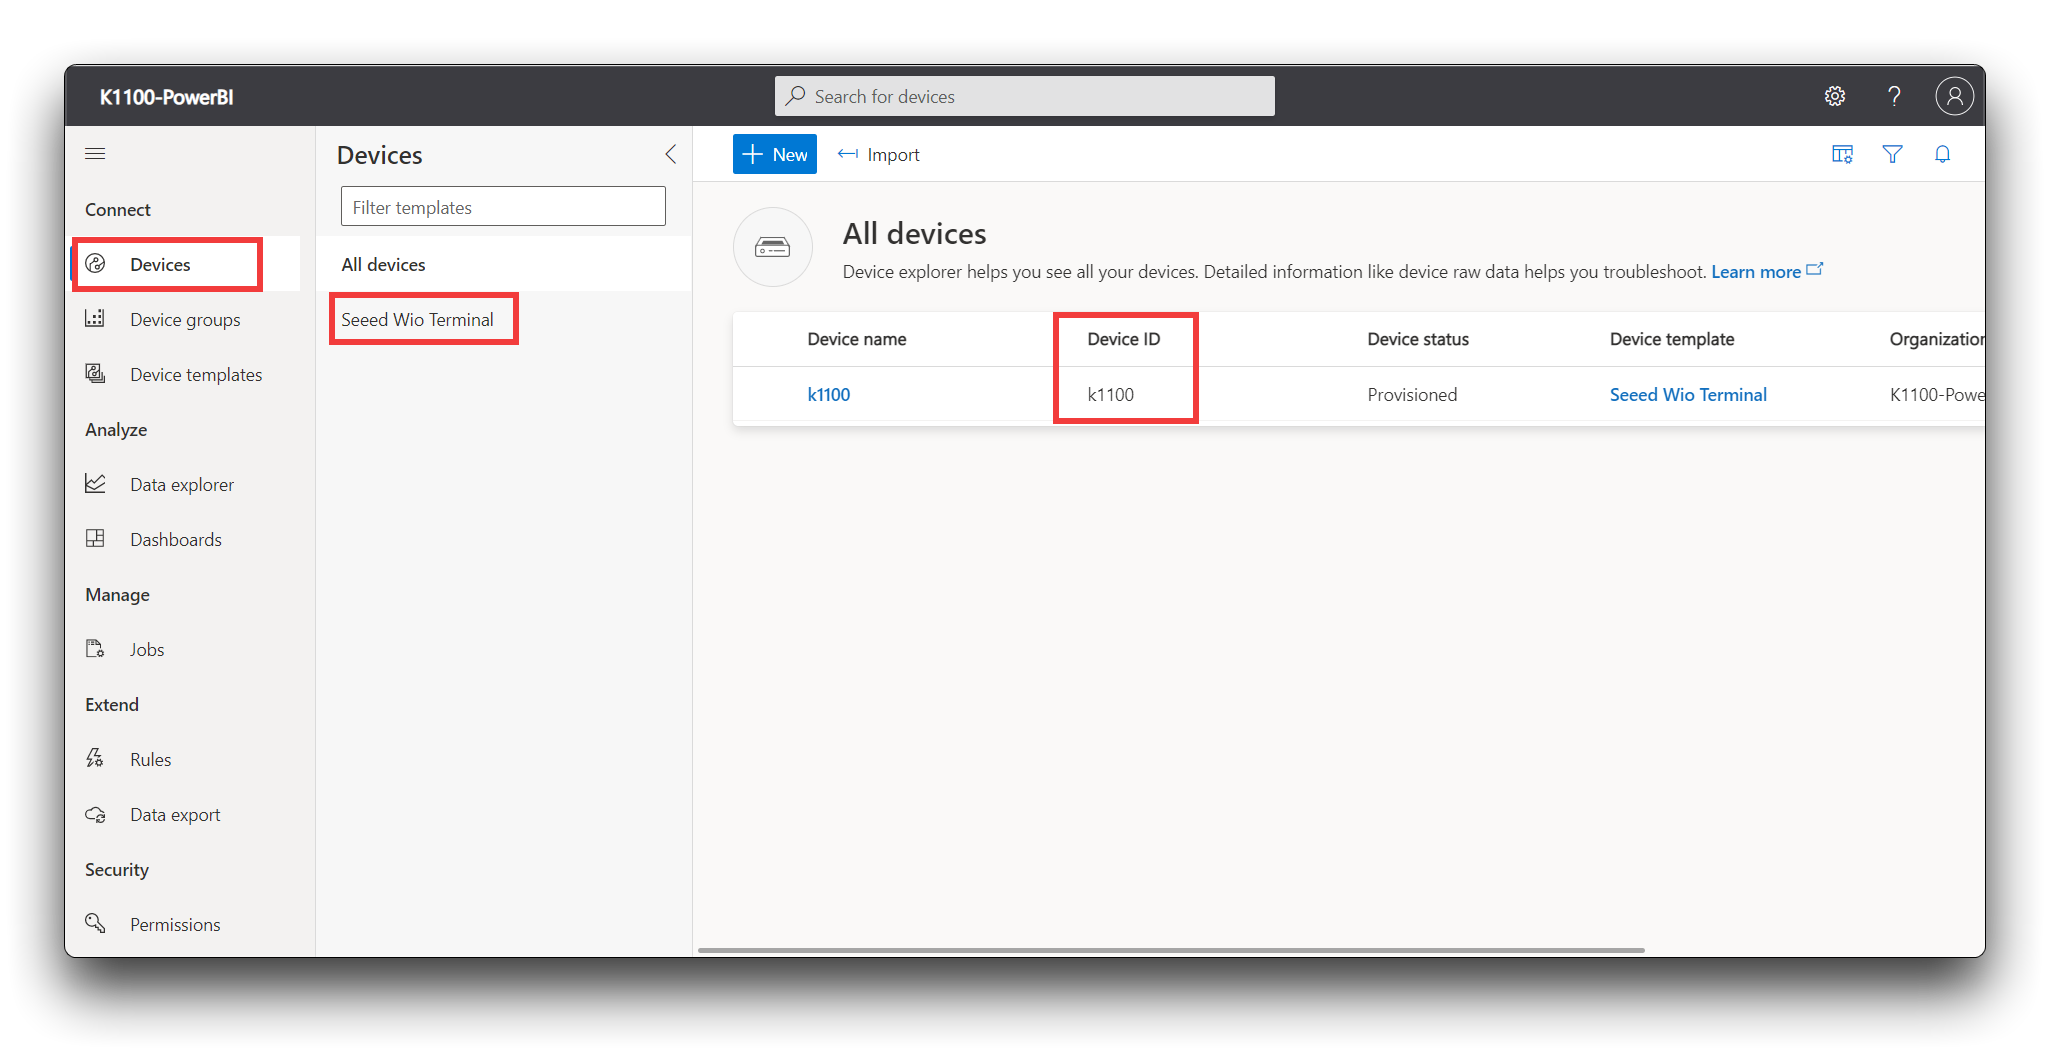
**Step 1.** Note the Device ID.
- Sign in to your [IoT Central application](https://apps.azureiotcentral.com/myapps). Select **Devices** in the left pane. Then select **Seeed Wio Terminal**.
Make a note of the **Device ID**. In the following screenshot, the ID is **k1100**:
**Step 2.** Create the logic app
- Sign in to the [Azure portal](https://portal.azure.com/) and select **Create a resource** at the top left of the screen.
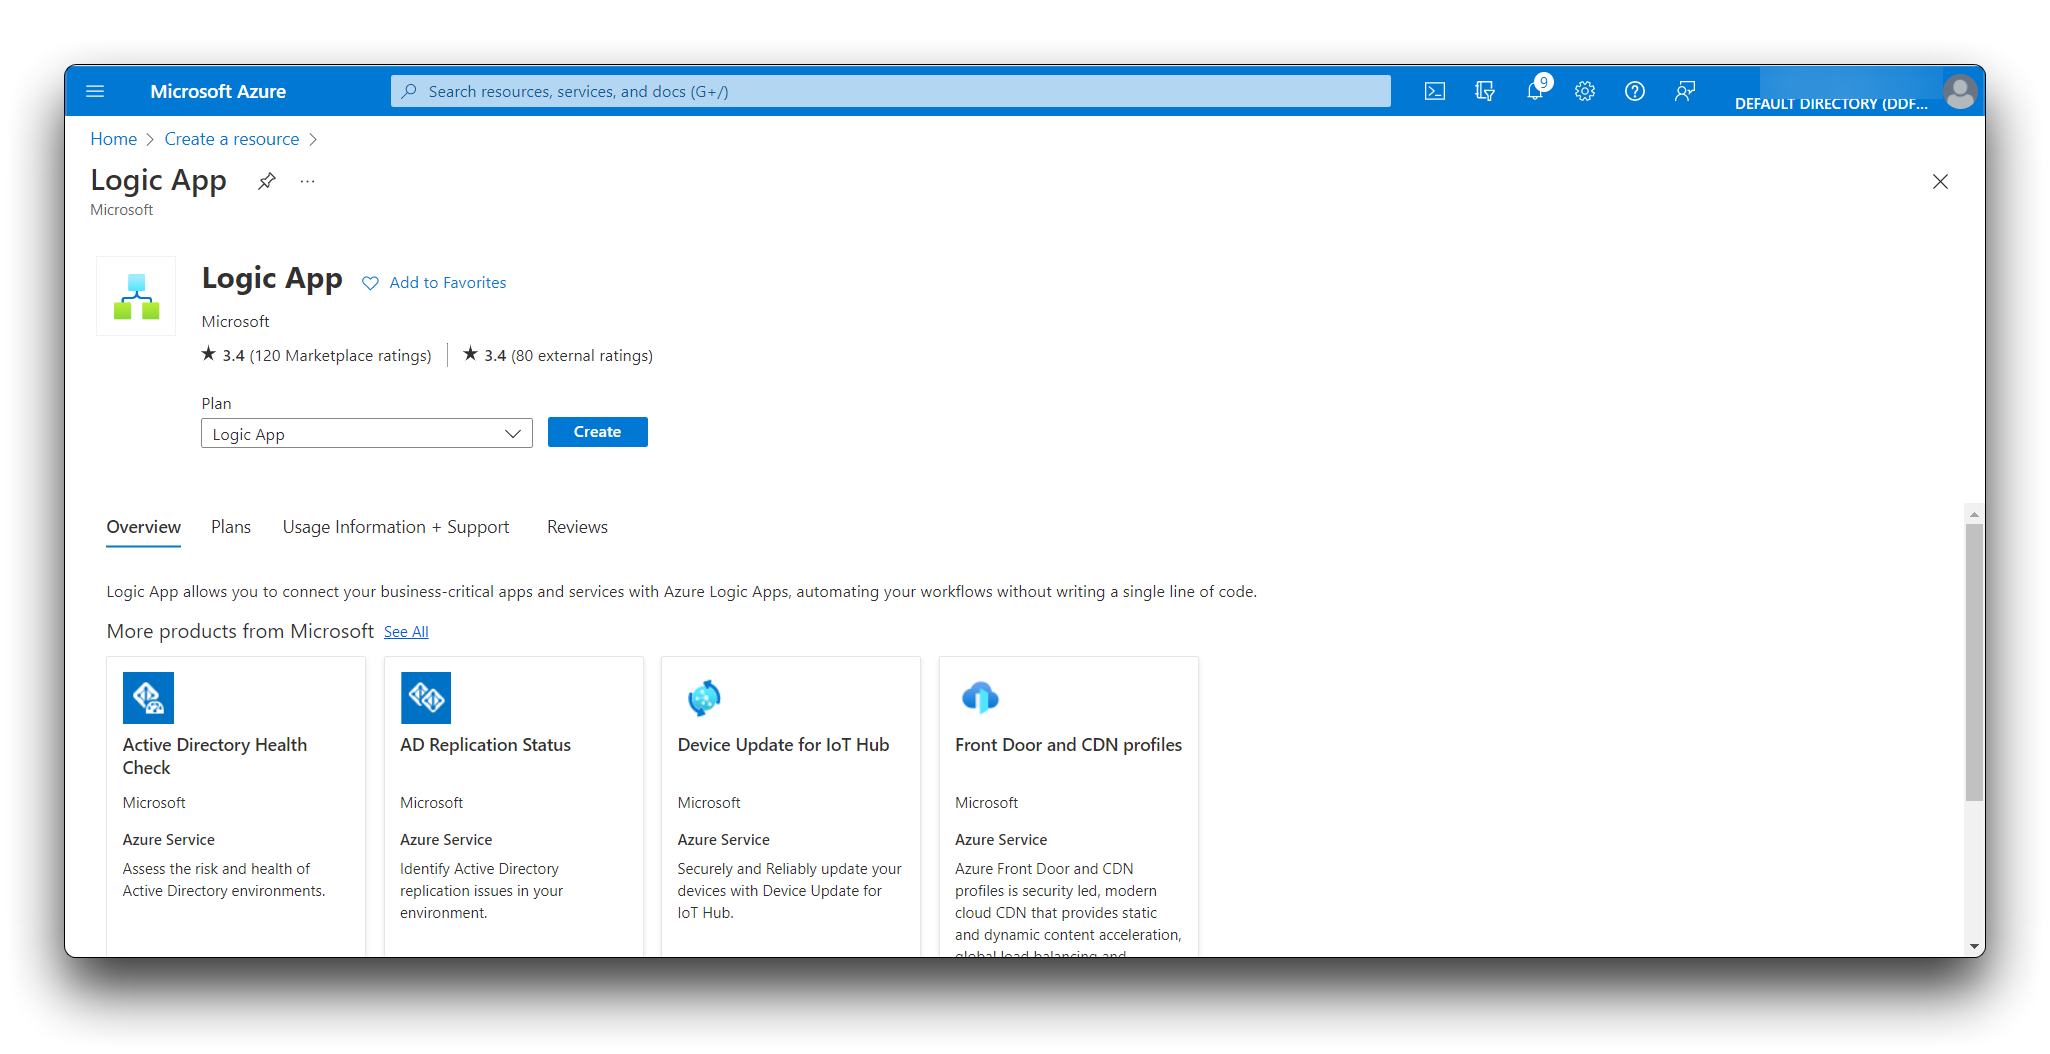
- In Search the Marketplace, enter **Logic App**, and then press Enter.
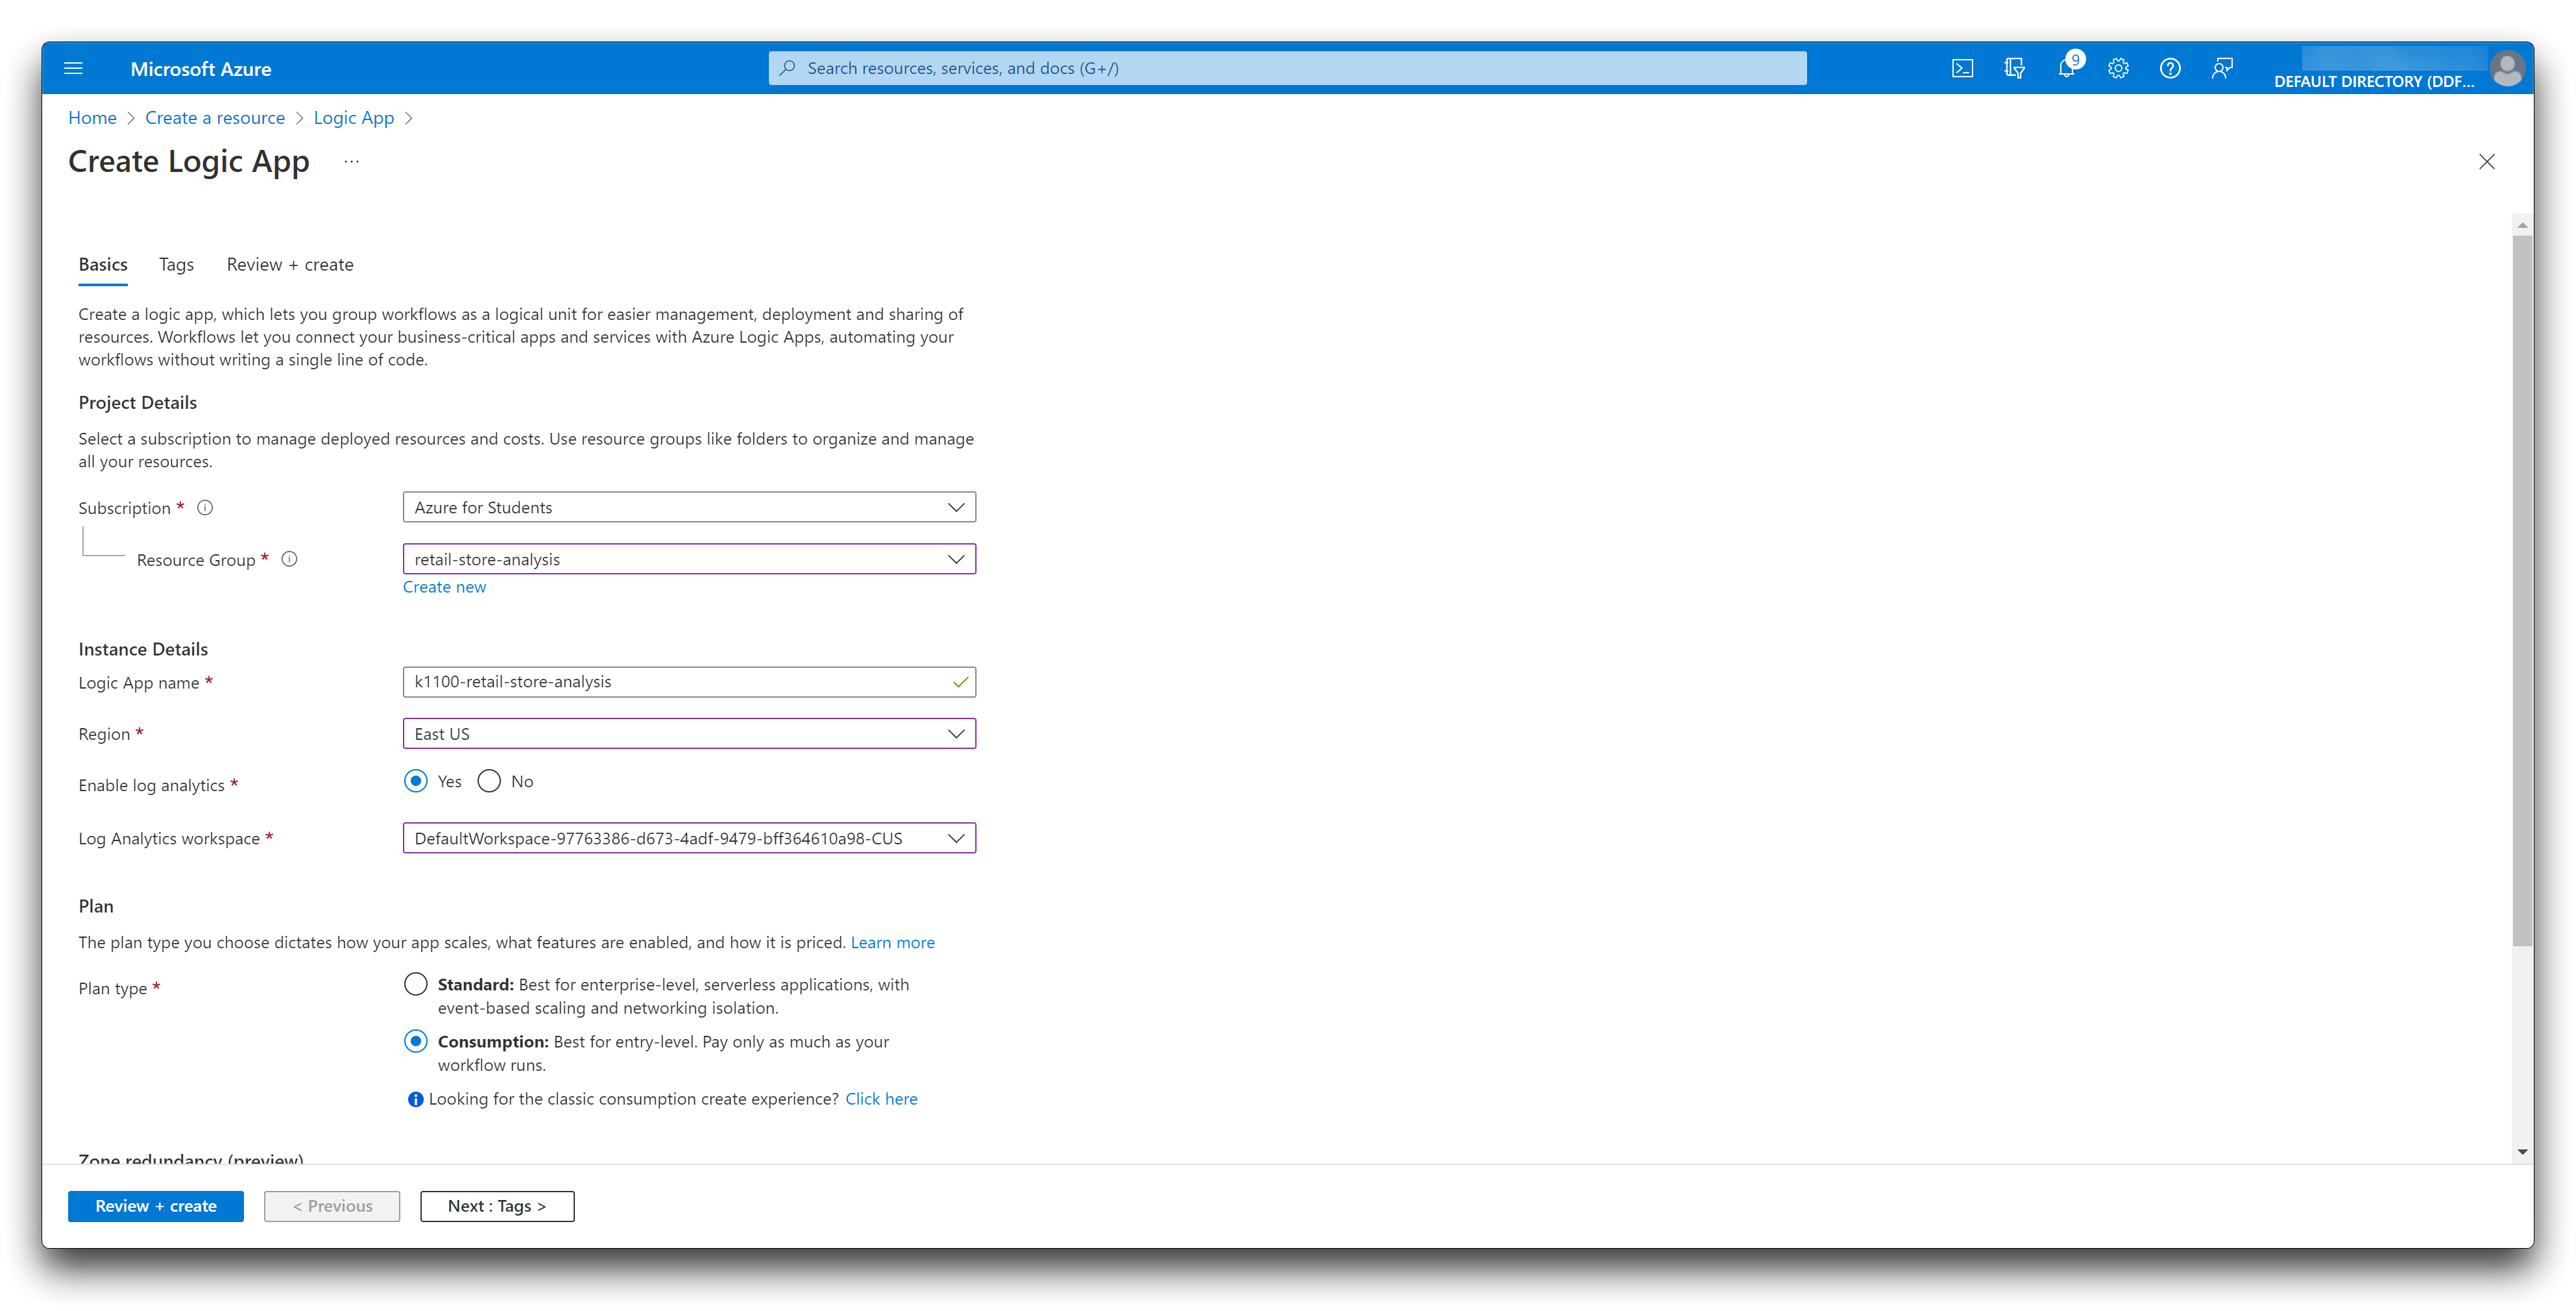
On the Logic App create page:
- Select the same **Subscription** you used to create your IoT Central application.
- Select the **retail-store-analysis** resource group.
- Enter a unique name for your logic app such as **yourname-retail-store-analysis**.
- Select the same location you used for your IoT Central application.
- Select the Type as **Consumption**.
Select Create. You may have to wait a few minutes for the system to provision the resources.
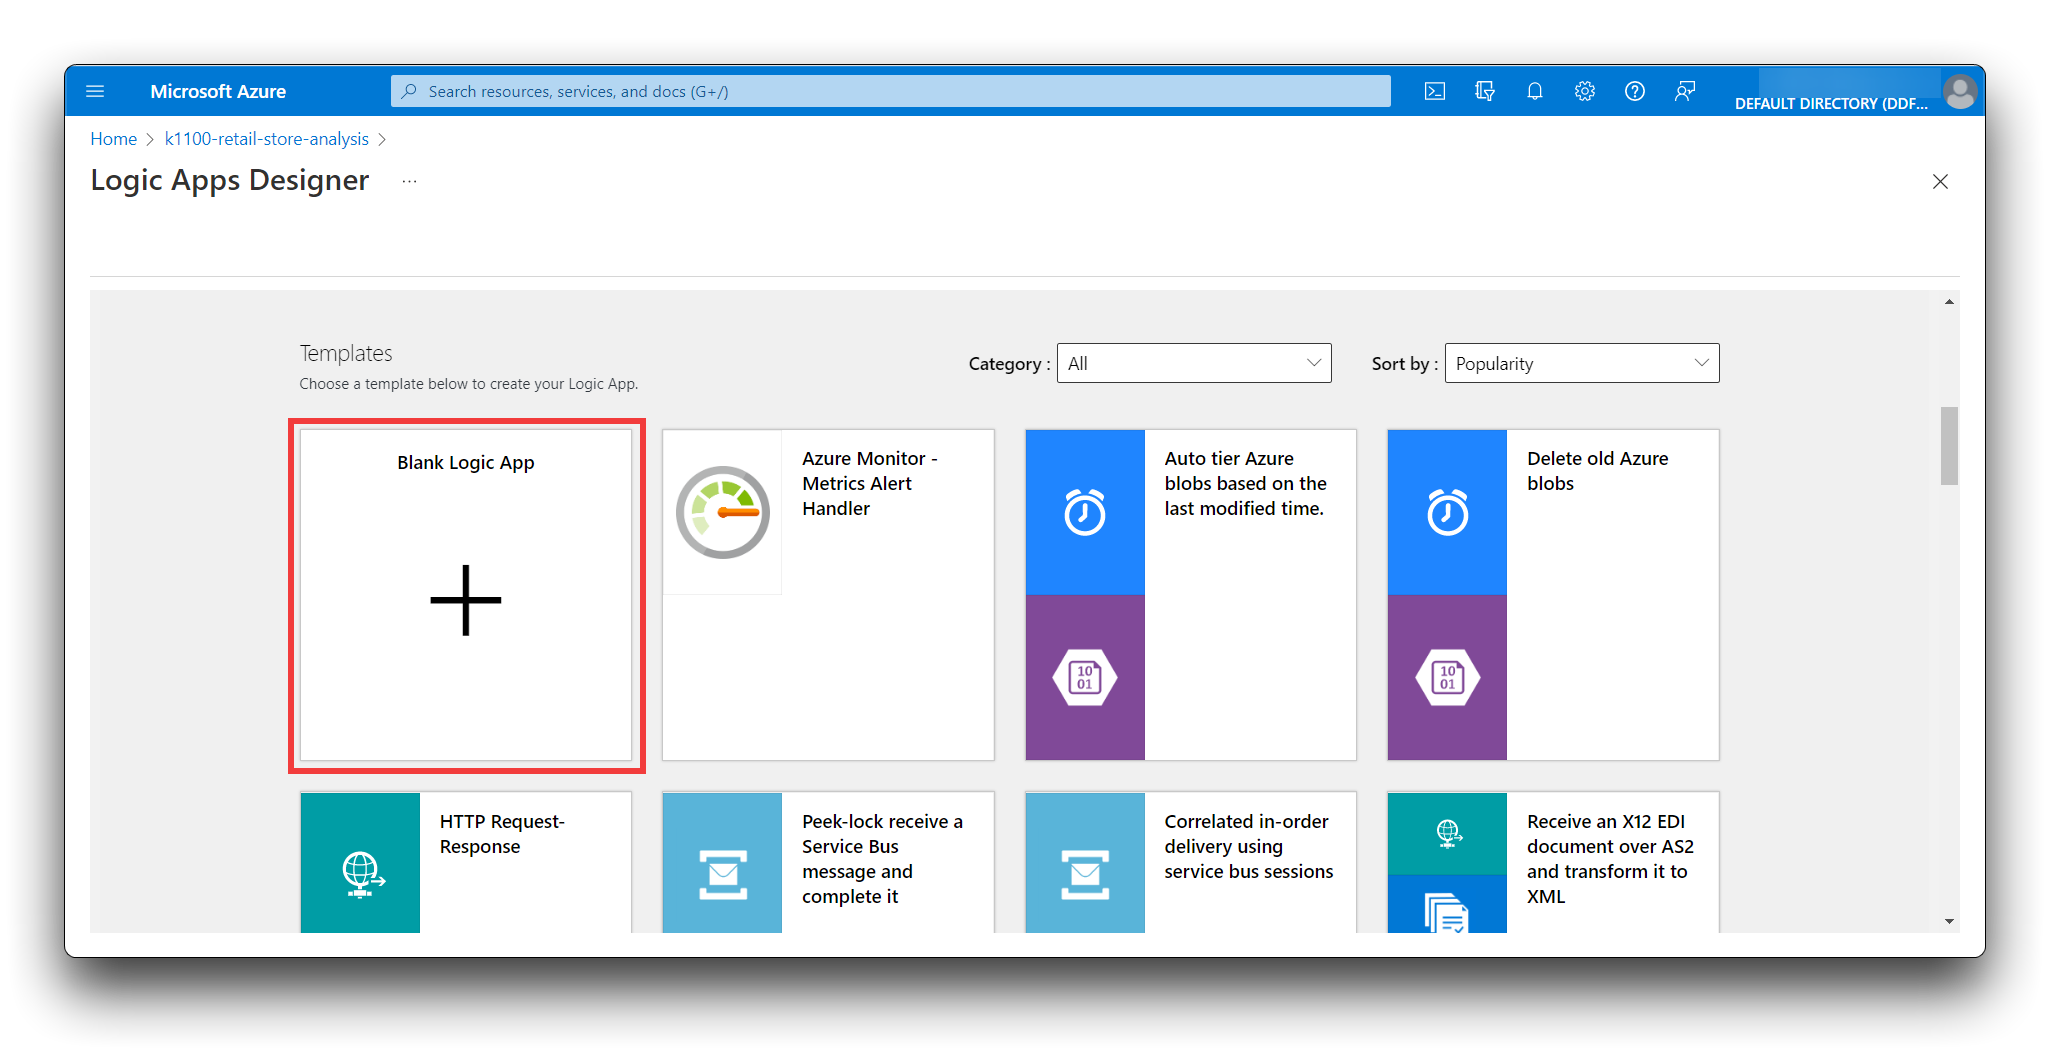
**Step 2.** Configure Logic Apps Designer
In the Azure portal, navigate to your new logic app. On the Logic Apps Designer page, scroll down and select **Blank Logic App**.
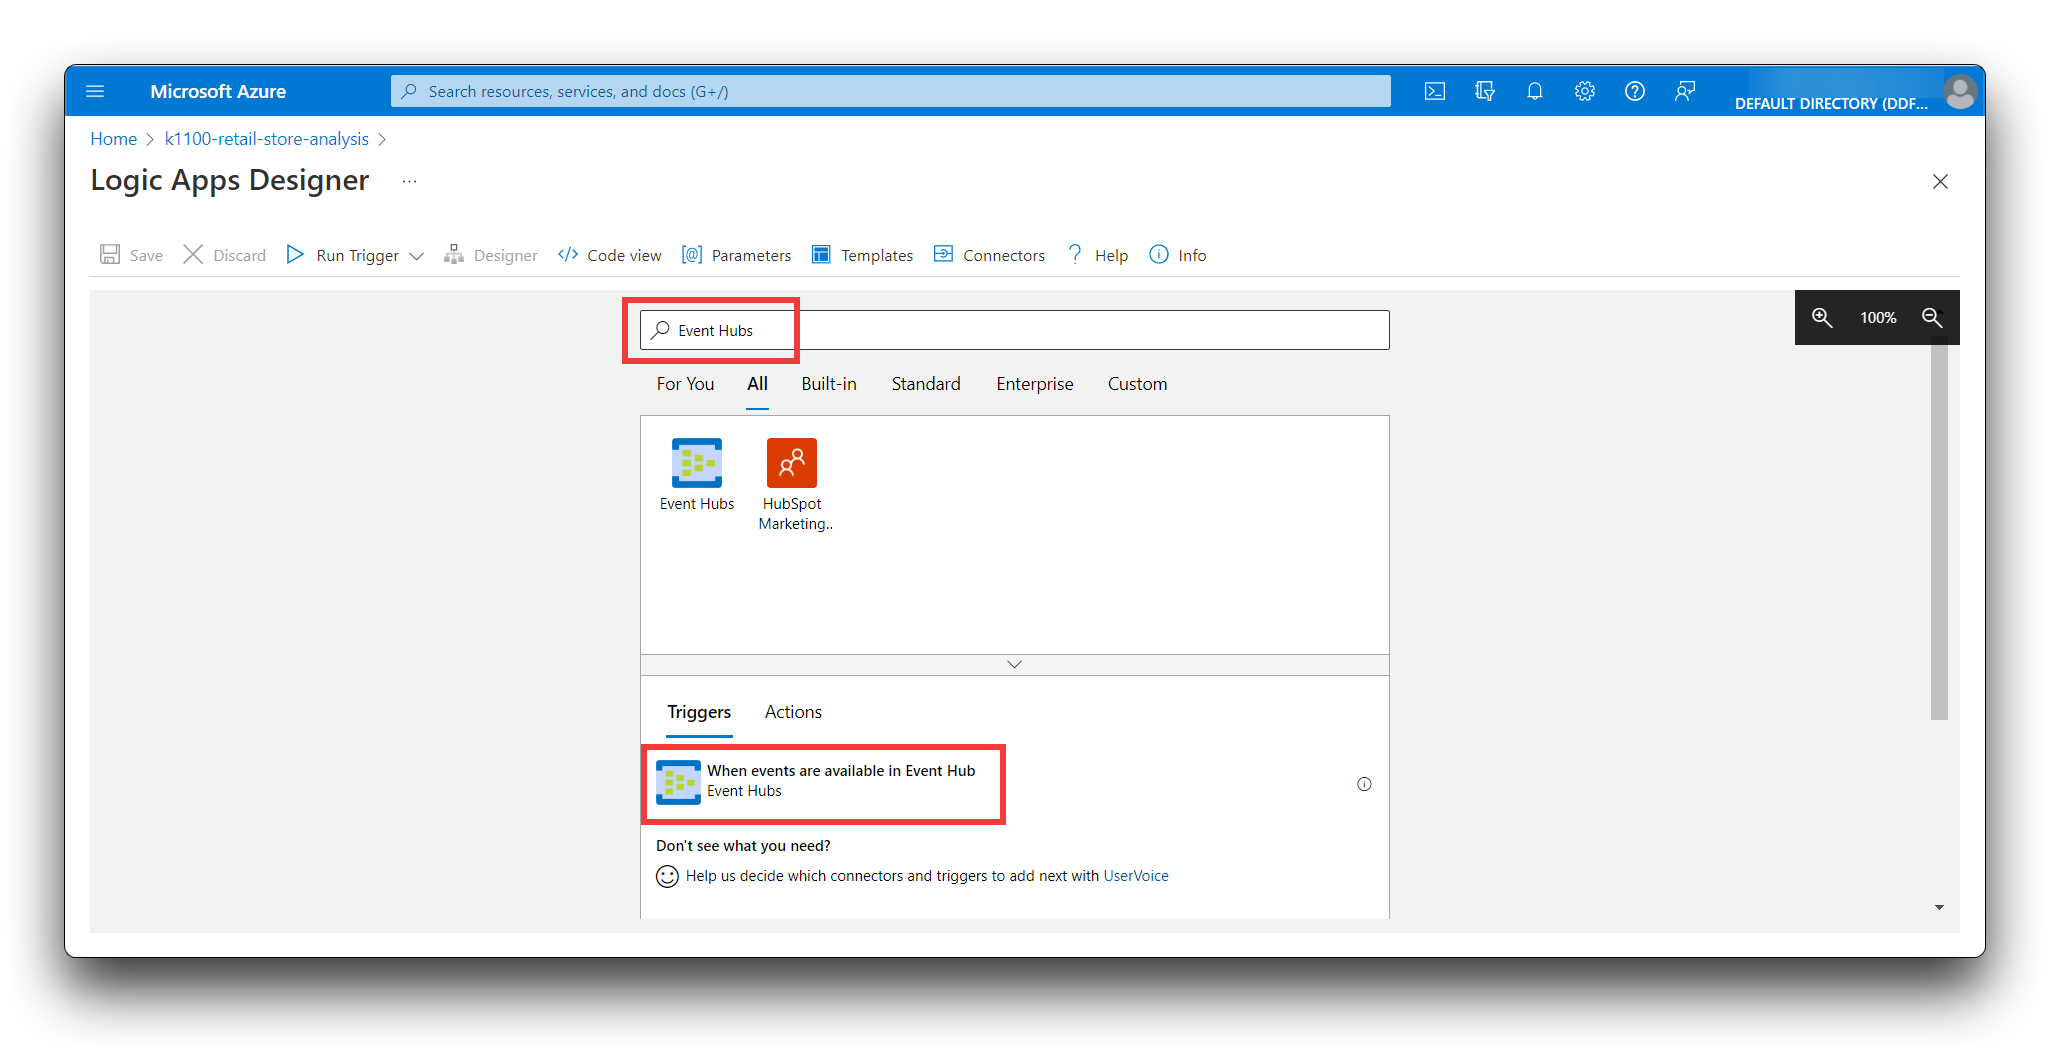
- In **Search connectors and triggers**, enter **Event Hubs**.
- In **Triggers**, select **When events are available in Event Hub**.
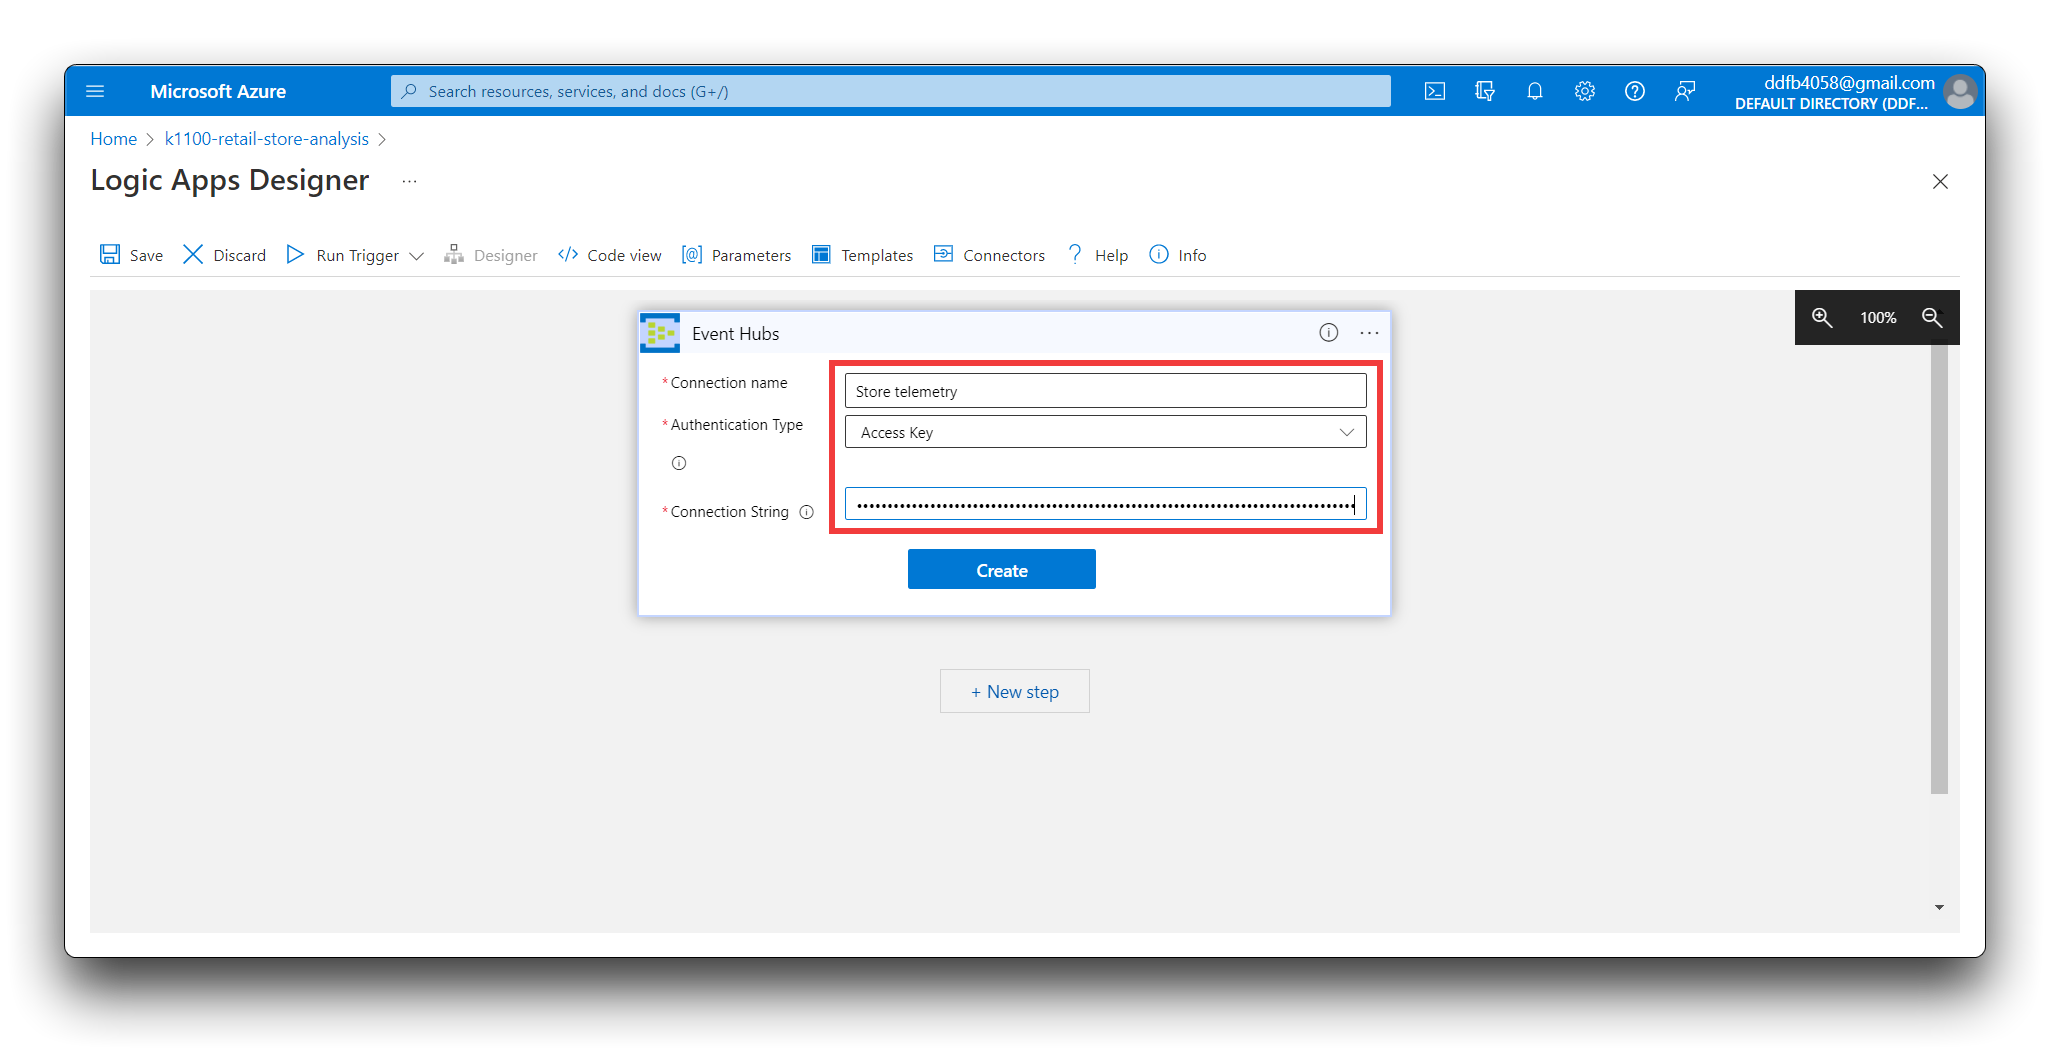
- Enter **Store telemetry** as the **Connection name**.
- Select **Access key** as the **Authentication Type**.
- Paste in the event hub connection string for the **RootManageSharedAccessKey** policy you made a note of previously, and select **Create**.
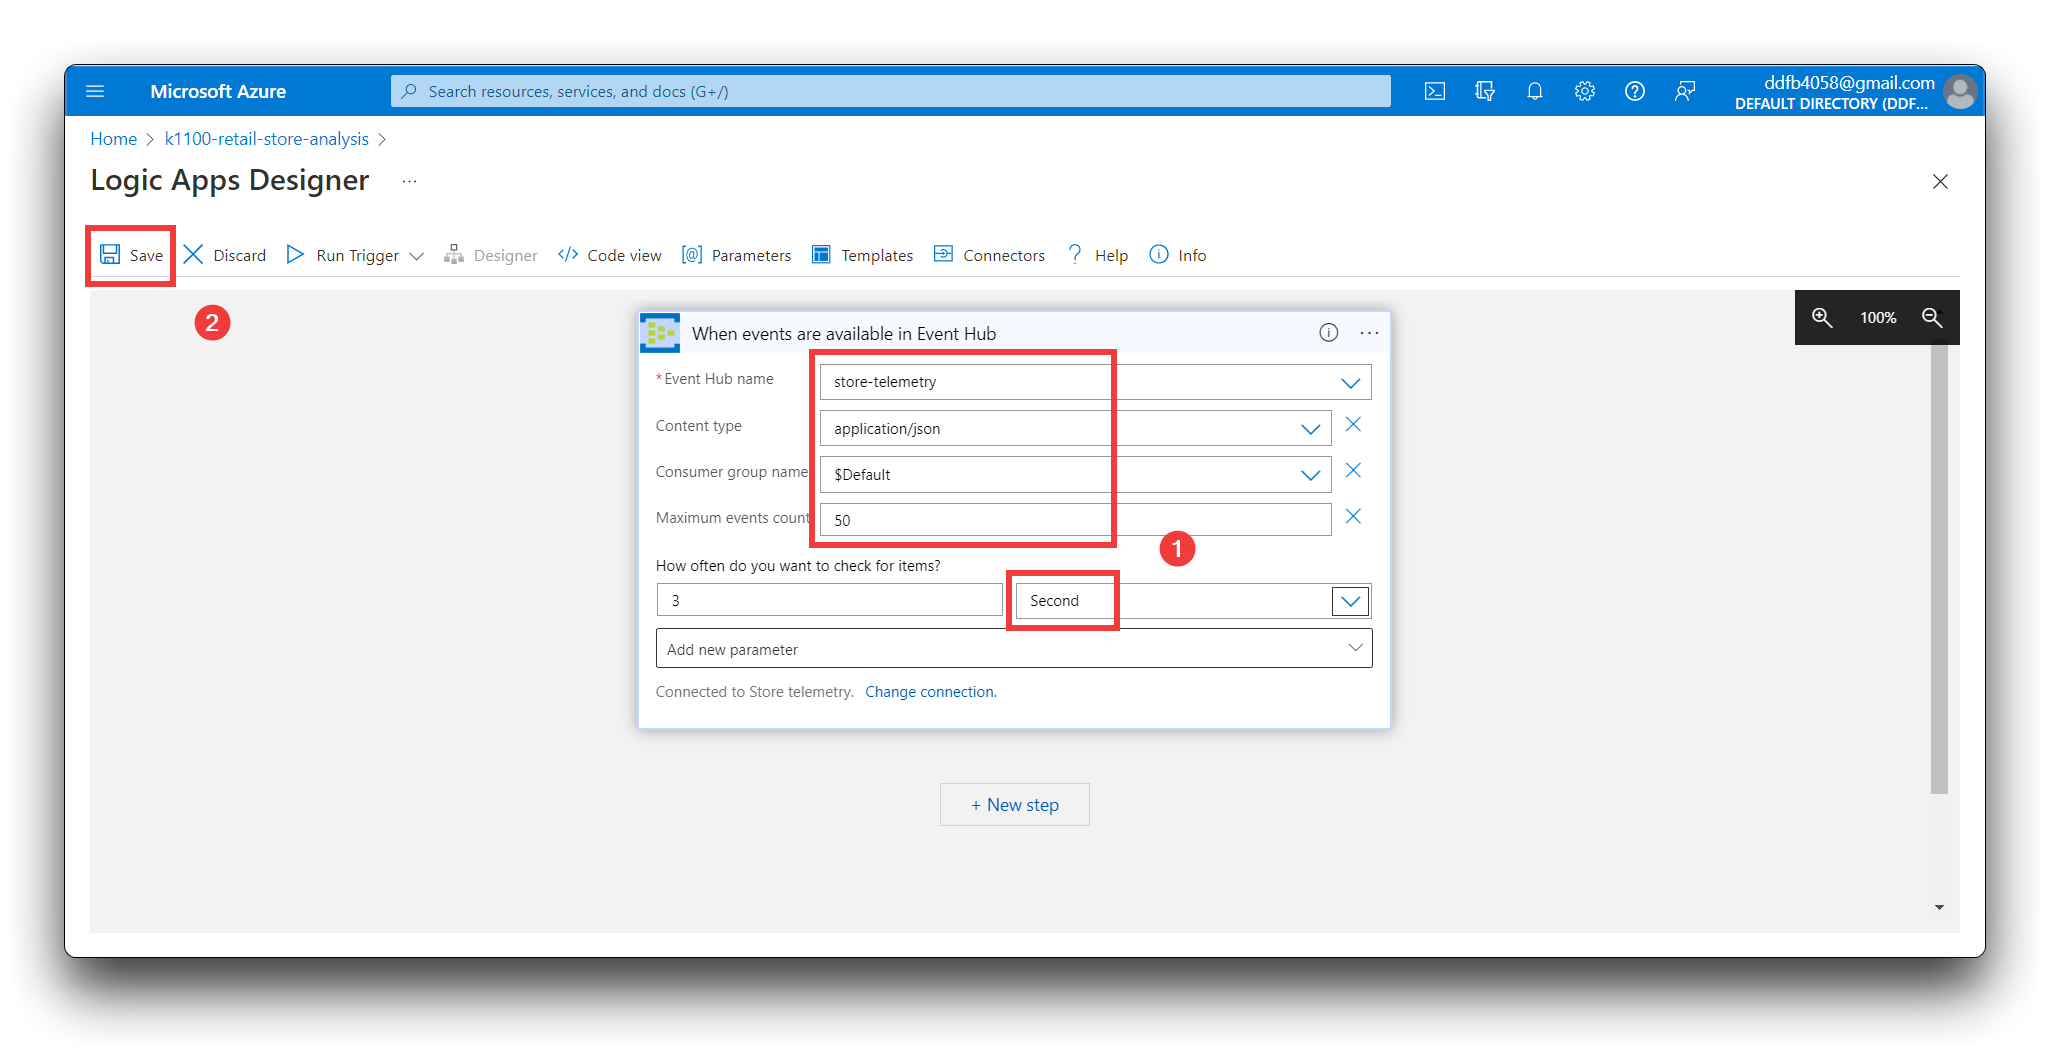
In the When events are available in Event Hub action:
- In **Event Hub name**, select **store-telemetry**.
- In **Content type**, select **application/json**.
- Set the Interval to three and the Frequency to seconds
- Select Save to save your logic app.
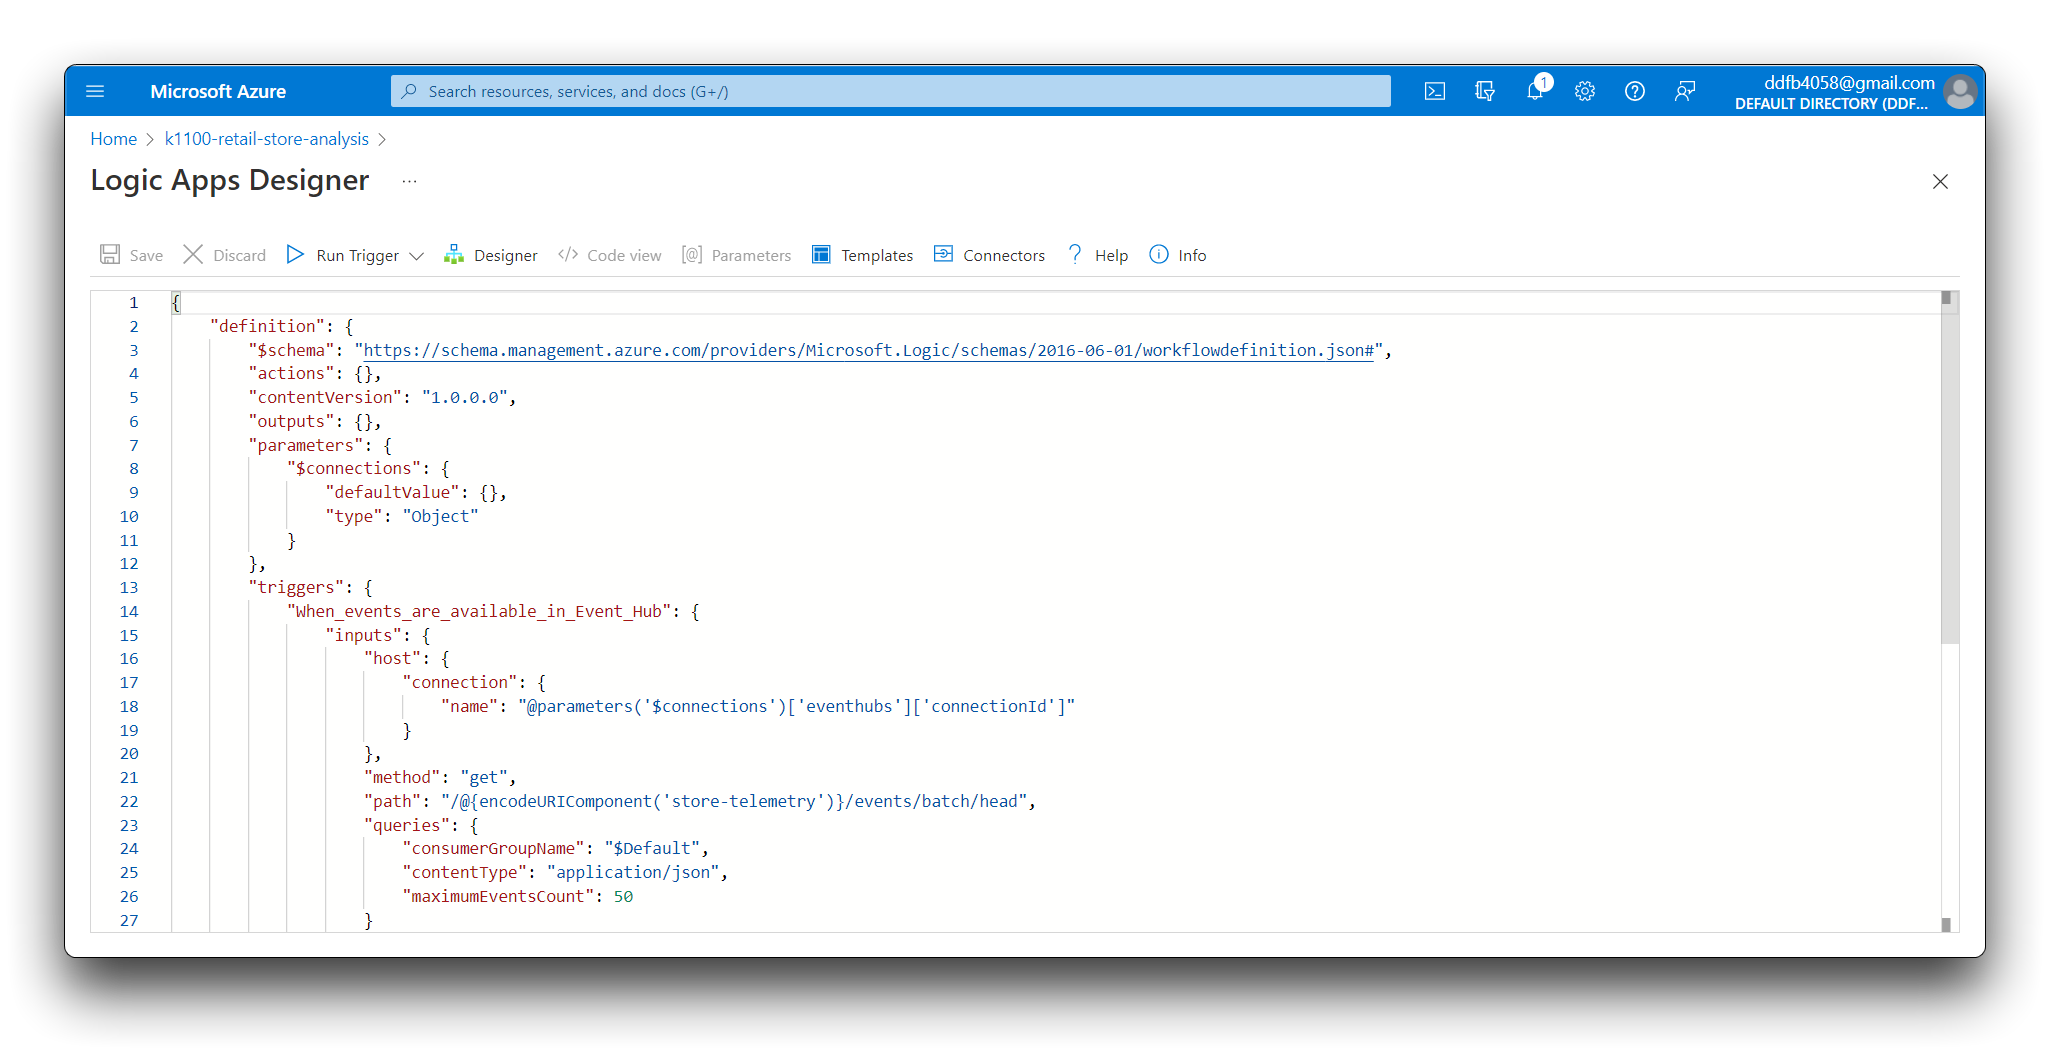
To add the logic to your logic app design, select **Code view**:
Replace `"actions: {},"` with the following JSON. Then replace the placeholder `[YOUR RUUVITAG DEVICE ID]` with the ID of your Wio Terminal.
```JSON
"actions": {
"Initialize_Device_ID_variable": {
"inputs": {
"variables": [
{
"name": "DeviceID",
"type": "String"
}
]
},
"runAfter": {},
"type": "InitializeVariable"
},
"Parse_Telemetry": {
"inputs": {
"content": "@triggerBody()?['ContentData']",
"schema": {
"properties": {
"deviceId": {
"type": "string"
},
"enqueuedTime": {
"type": "string"
},
"telemetry": {
"properties": {
"accelX": {
"type": "number"
},
"accelY": {
"type": "number"
},
"accelZ": {
"type": "number"
}
},
"type": "object"
},
"templateId": {
"type": "string"
}
},
"type": "object"
}
},
"runAfter": {
"Initialize_Device_ID_variable": [
"Succeeded"
]
},
"type": "ParseJson"
},
"Set_Device_ID_variable": {
"inputs": {
"name": "DeviceID",
"value": "@body('Parse_Telemetry')?['deviceId']"
},
"runAfter": {
"Parse_Telemetry": [
"Succeeded"
]
},
"type": "SetVariable"
},
"Switch_by_DeviceID": {
"cases": {
"Occupancy": {
"actions": {},
"case": "Occupancy"
},
"Sensor_environment": {
"actions": {},
"case": "k1100"
}
},
"default": {
"actions": {}
},
"expression": "@variables('DeviceID')",
"runAfter": {
"Set_Device_ID_variable": [
"Succeeded"
]
},
"type": "Switch"
}
},
```
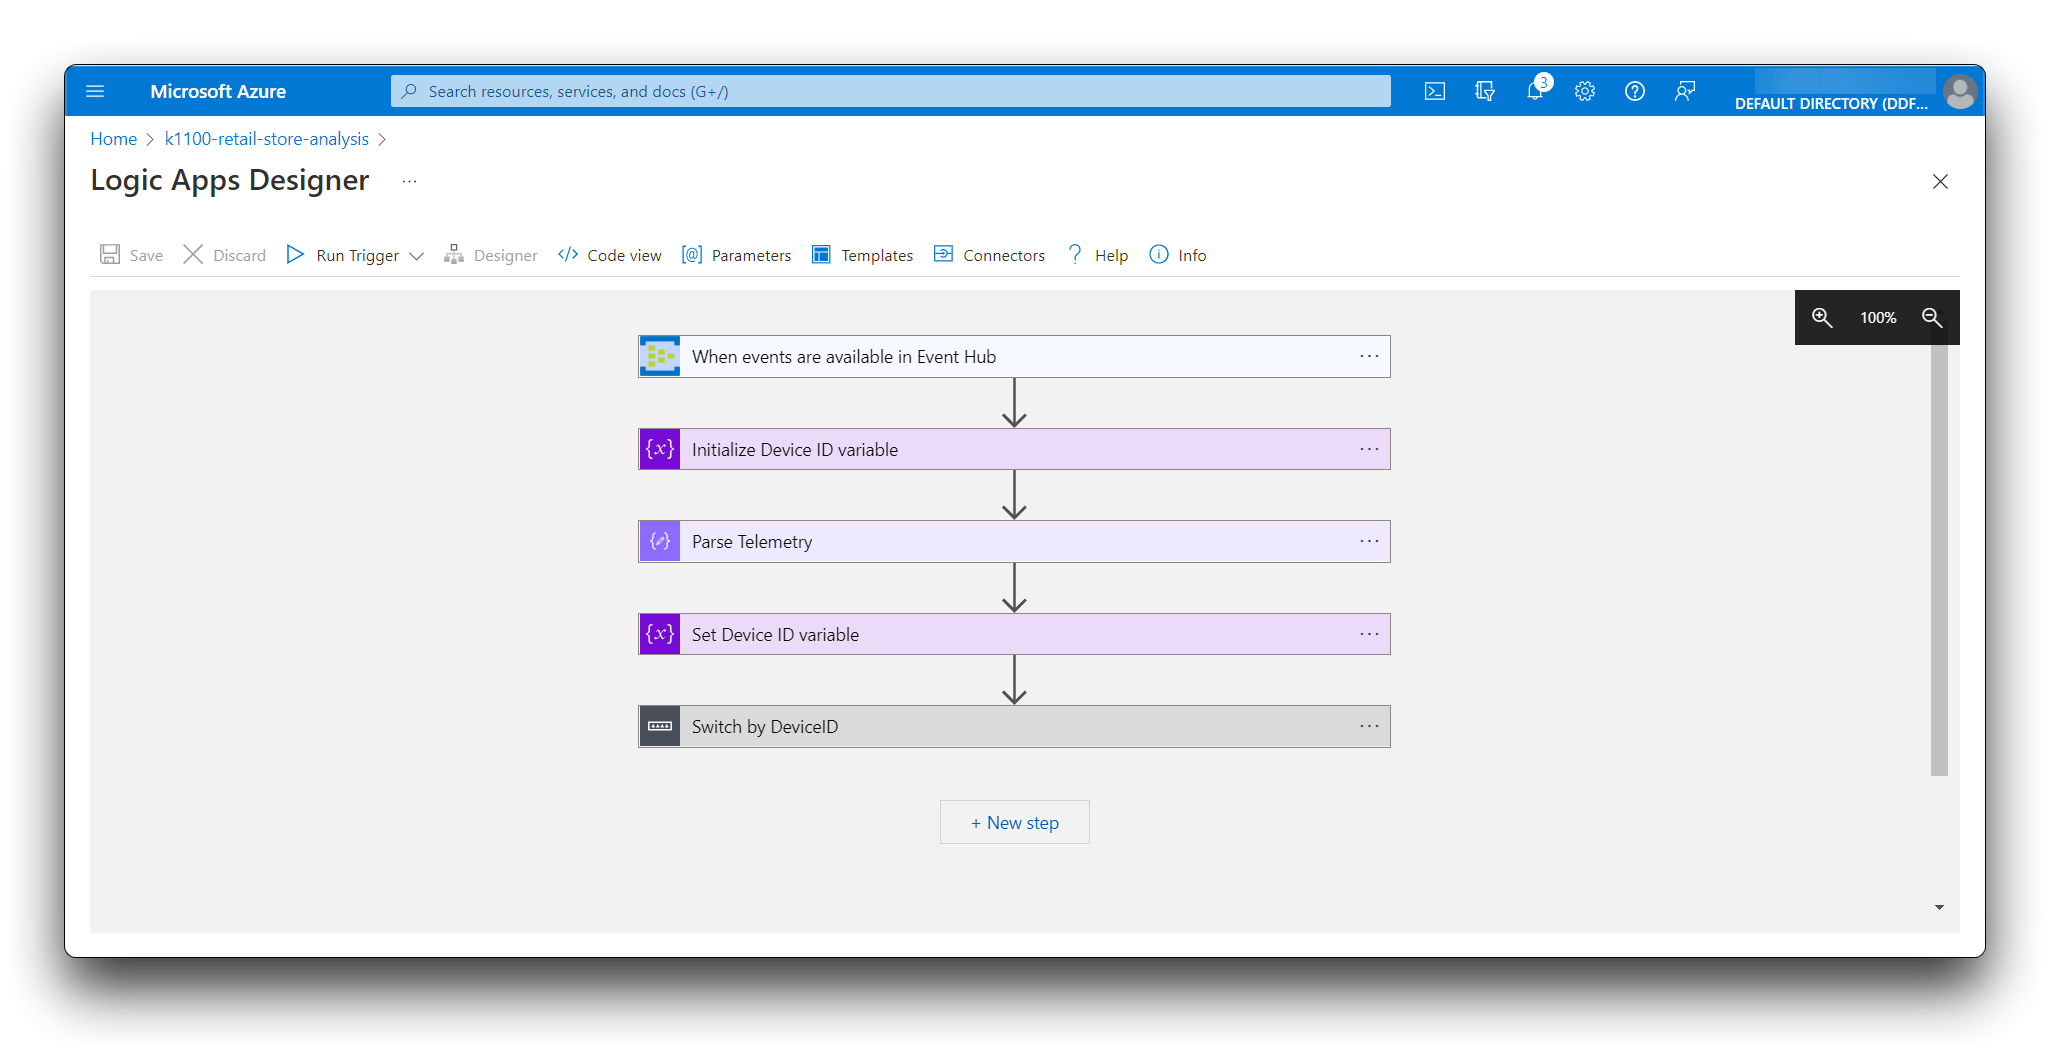
Select **Save** and then select **Designer** to see the visual version of the logic you added.
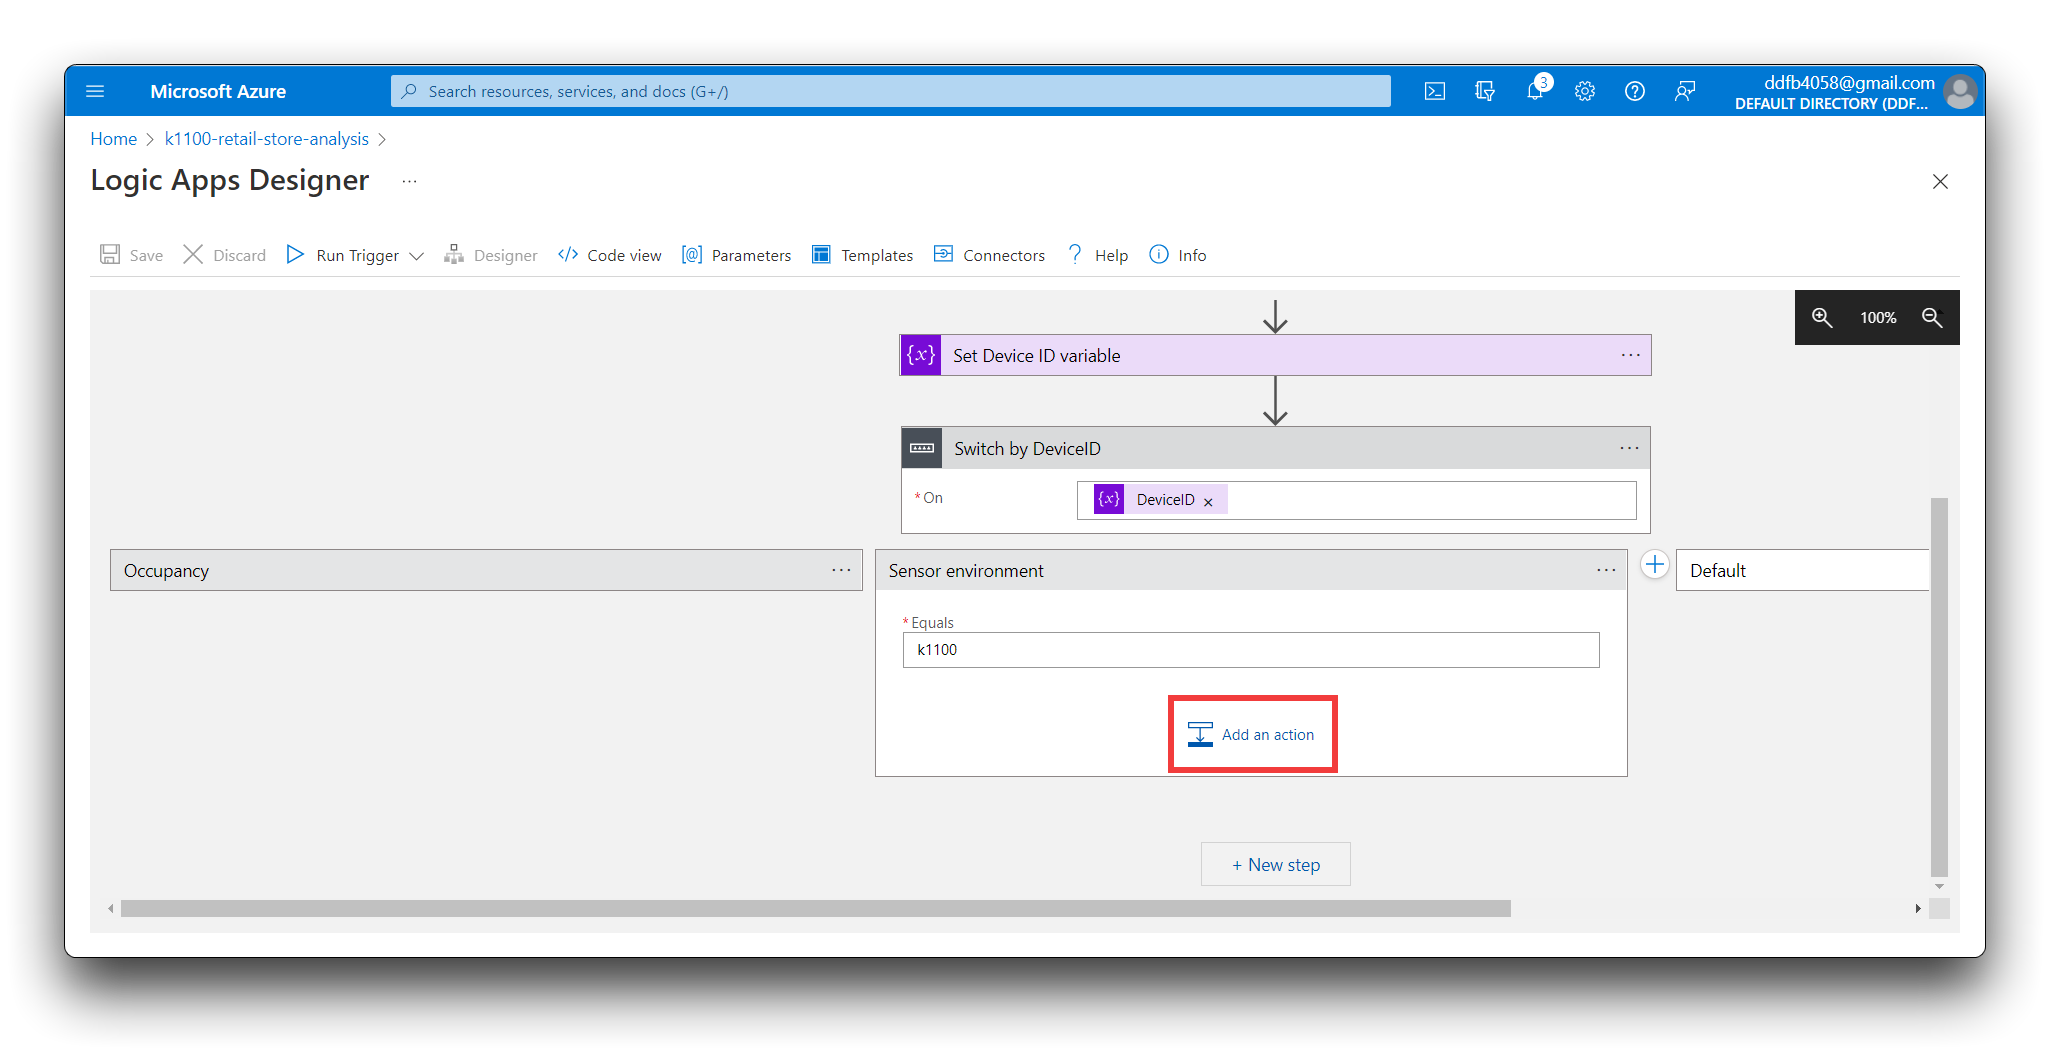
Select **Switch by DeviceID** to expand the action. Then select **Sensor environment**, and select **Add an action**.
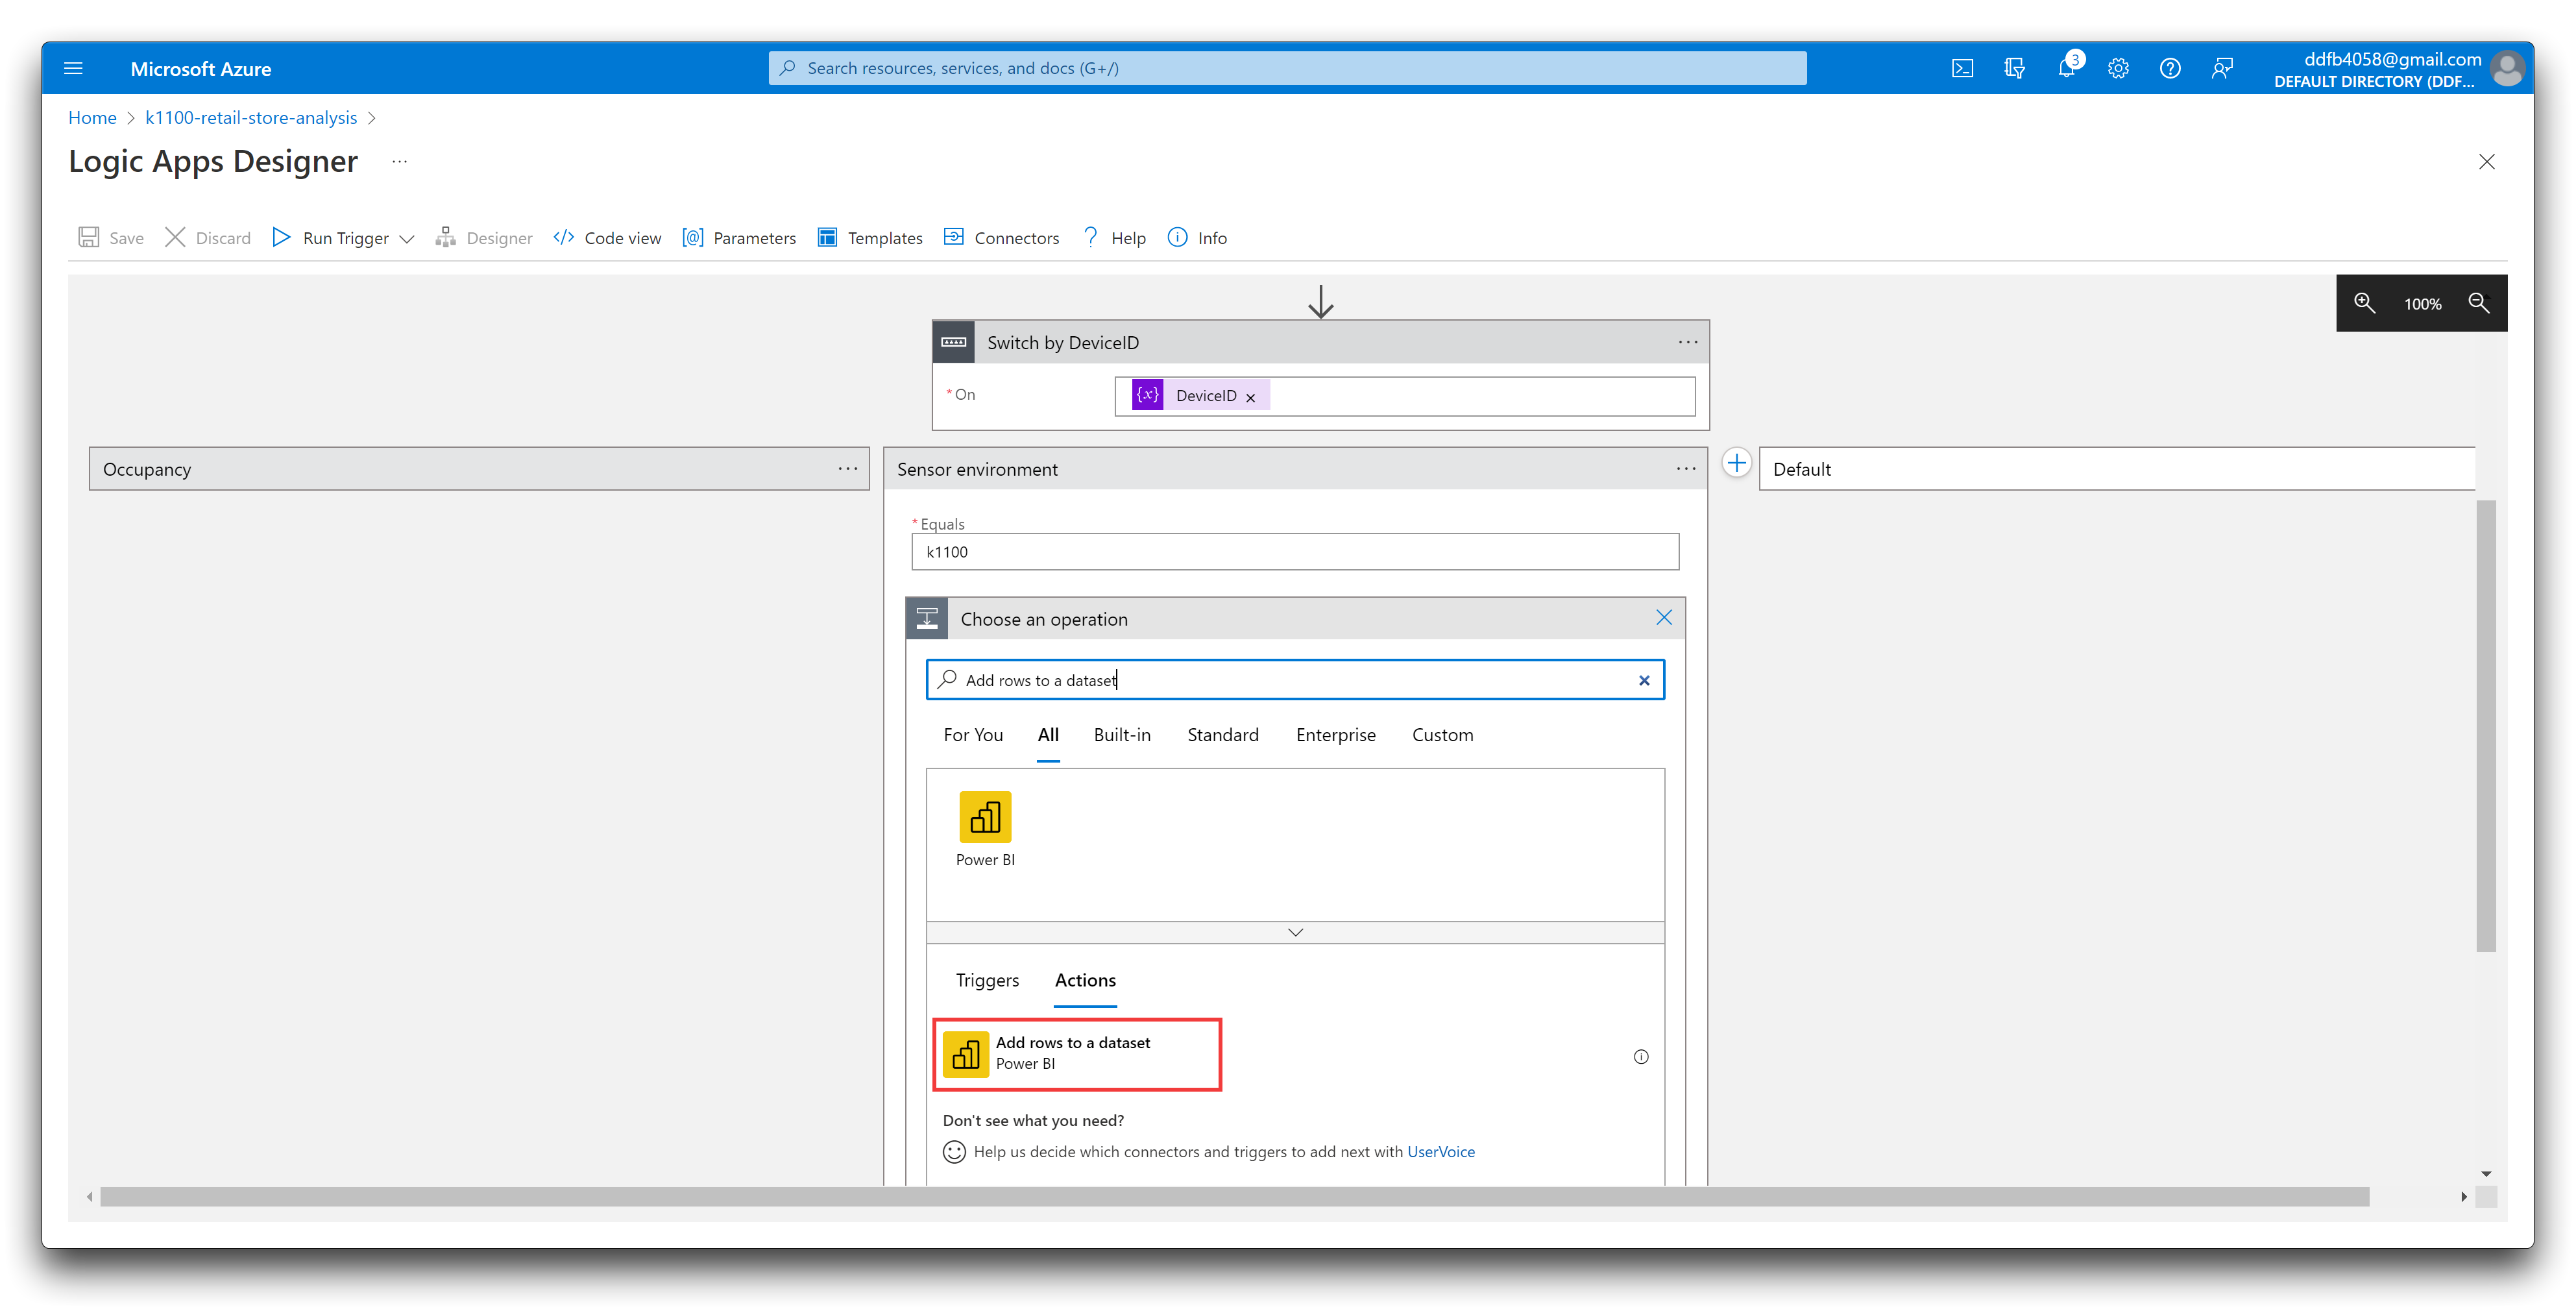
In **Search connectors and actions**, enter **Add rows to a dataset**. Select the **Power BI Add rows to a dataset** action.
Select **Sign in** and follow the prompts to sign in to your Power BI account. After the sign-in process is complete, in the Add rows to a dataset action:
- Select **In-store analytics - checkout** as the **Workspace**.
- Select **Sensor** as the **Dataset**.
- Select **RealTimeData** as the **Table**.
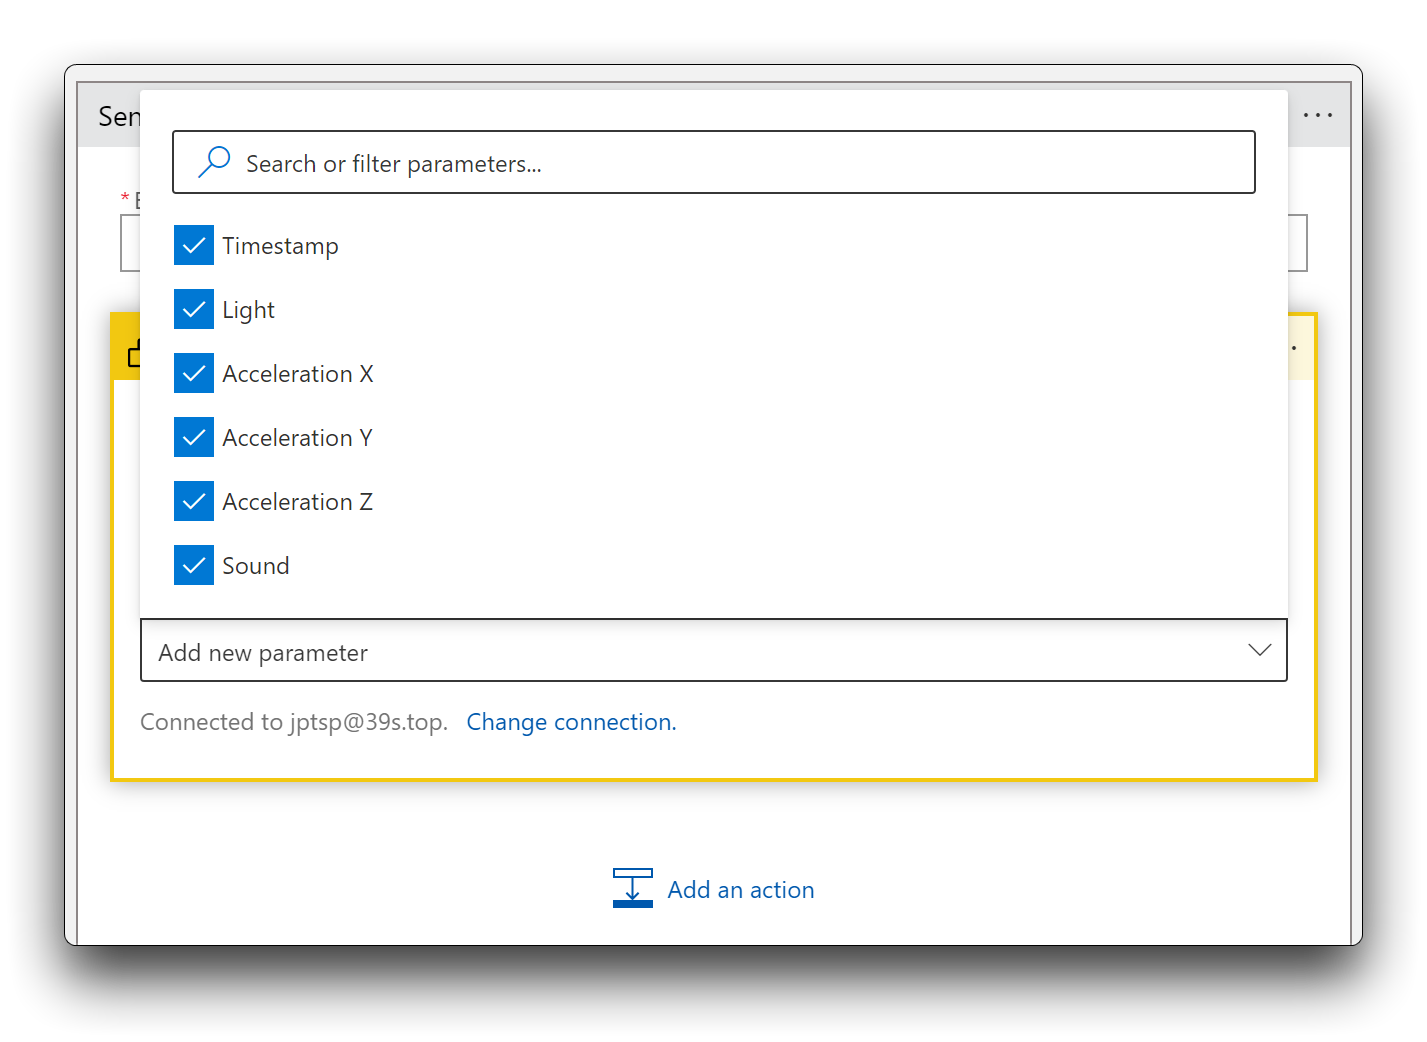
- Select **Add new parameter** and then select the **Timestamp**, **Light**, **Acceleration X**, **Acceleration Y**, **Acceleration Z** and **Sound** fields.
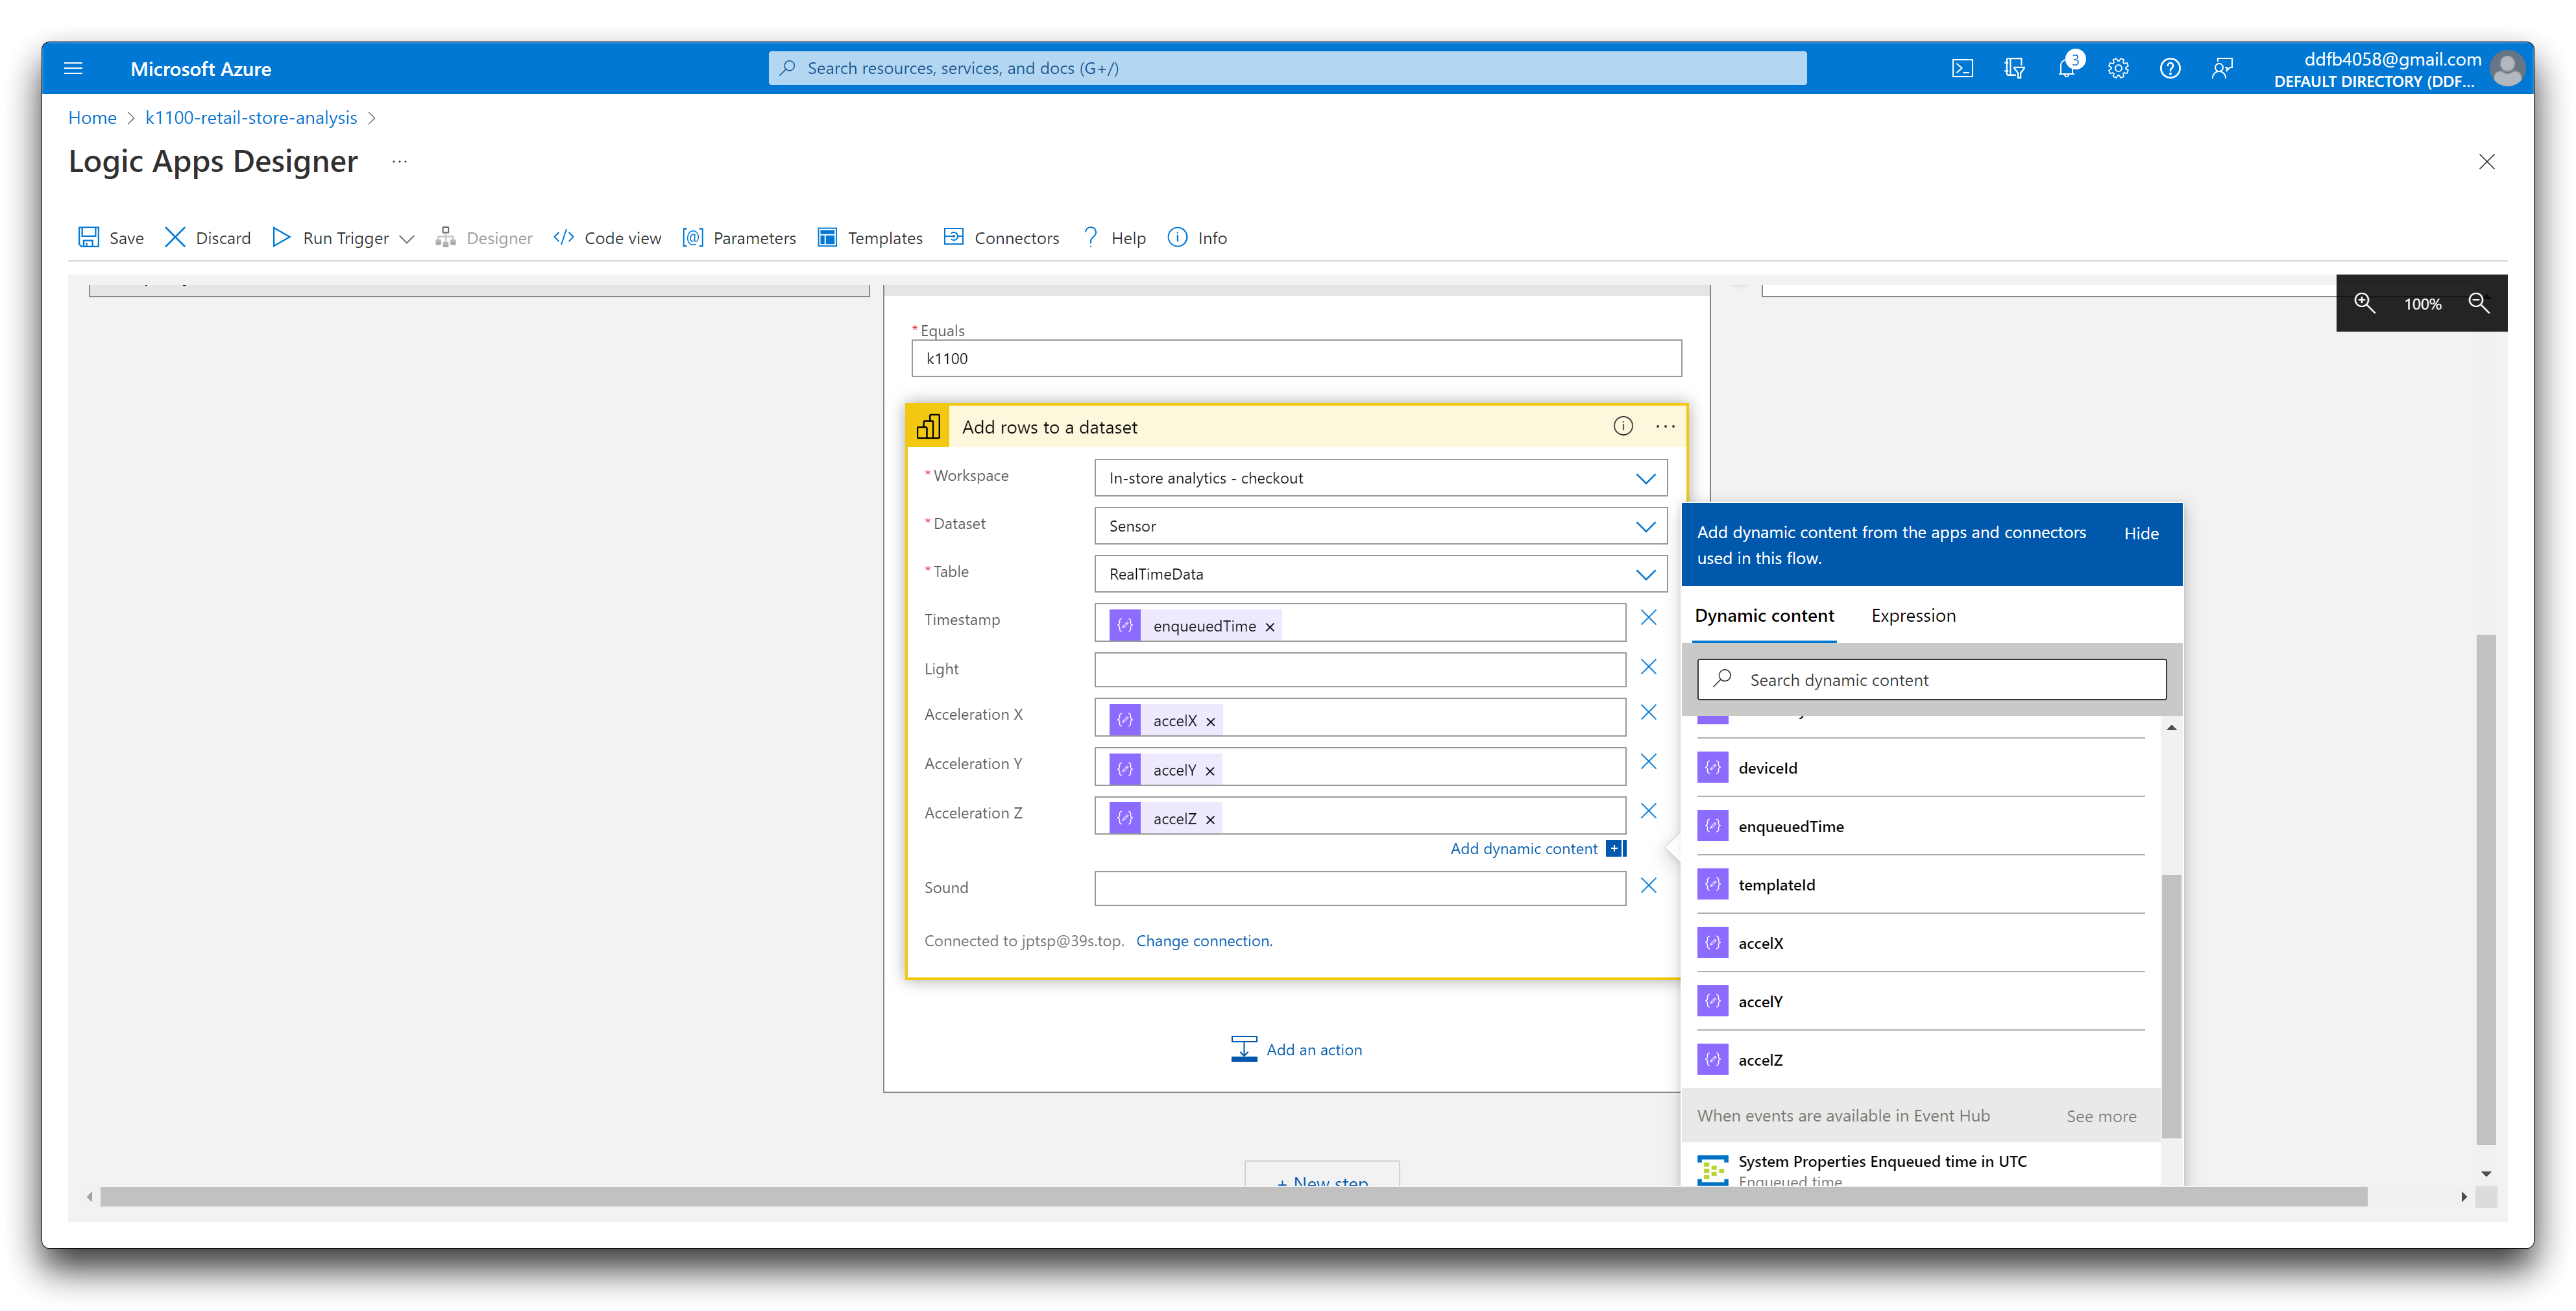
- Select the **Timestamp** field, and then select **enqueuedTime** from the Dynamic content list.
- Select the **Light** field, and then select **See more** next to Parse Telemetry. Then select Light.
- Select the **Acceleration X** field, and then select **See more** next to Parse Telemetry. Then select accelX.
- Select the **Acceleration Y** field, and then select **See more** next to Parse Telemetry. Then select accelY.
- Select the **Acceleration Z** field, and then select **See more** next to Parse Telemetry. Then select accelZ.
- Select the **Sound** field, and then select **See more** next to Parse Telemetry. Then select Sound.
Select **Save** to save your changes. The Sensor environment action looks like the following screenshot.
Select the Zone 2 environment action, and select Add an action.
In Search connectors and actions, enter Add rows to a dataset.
The logic app runs automatically. To see the status of each run, navigate to the Overview page for the logic app in the Azure portal and select Runs history. Select Refresh to update the list of runs.
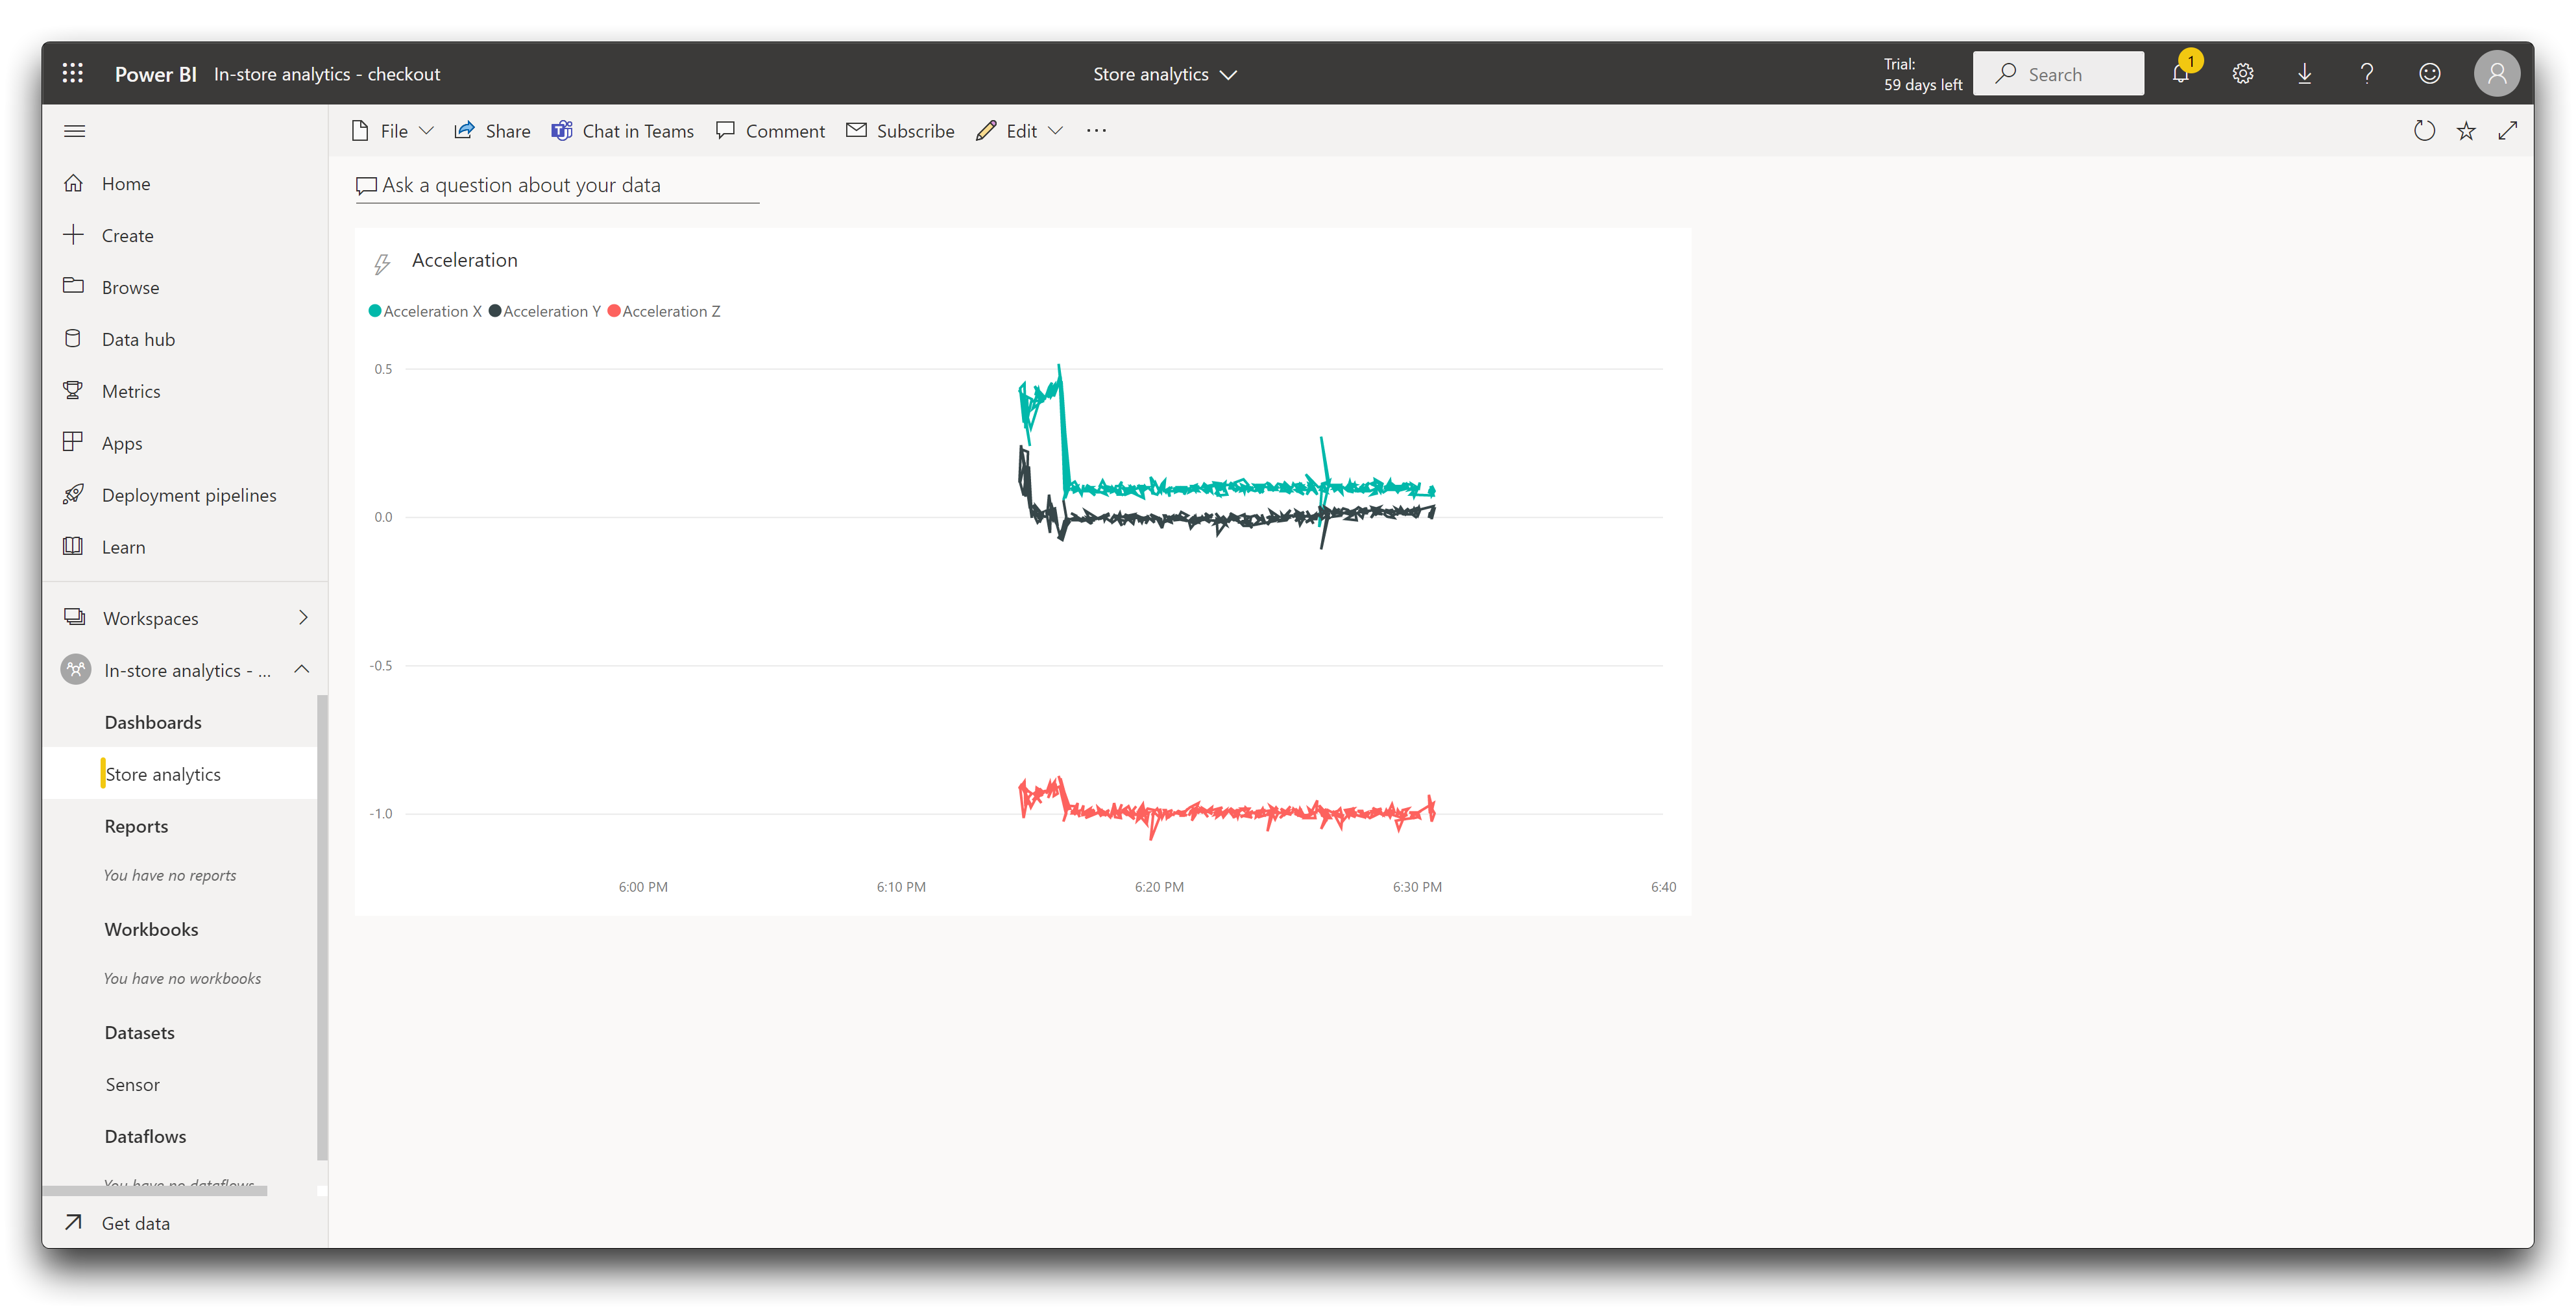
## Create a Power BI dashboard
Now you have telemetry flowing from your IoT Central application through your event hub. Then your logic app parses the event hub messages and adds them to a Power BI streaming dataset. Now, you can create a Power BI dashboard to visualize the telemetry:
**Step 1.** Sign in to your [Power BI account](https://app.powerbi.com/).
**Step 2.** Select **Workspaces** > **In-store analytics - checkout**.
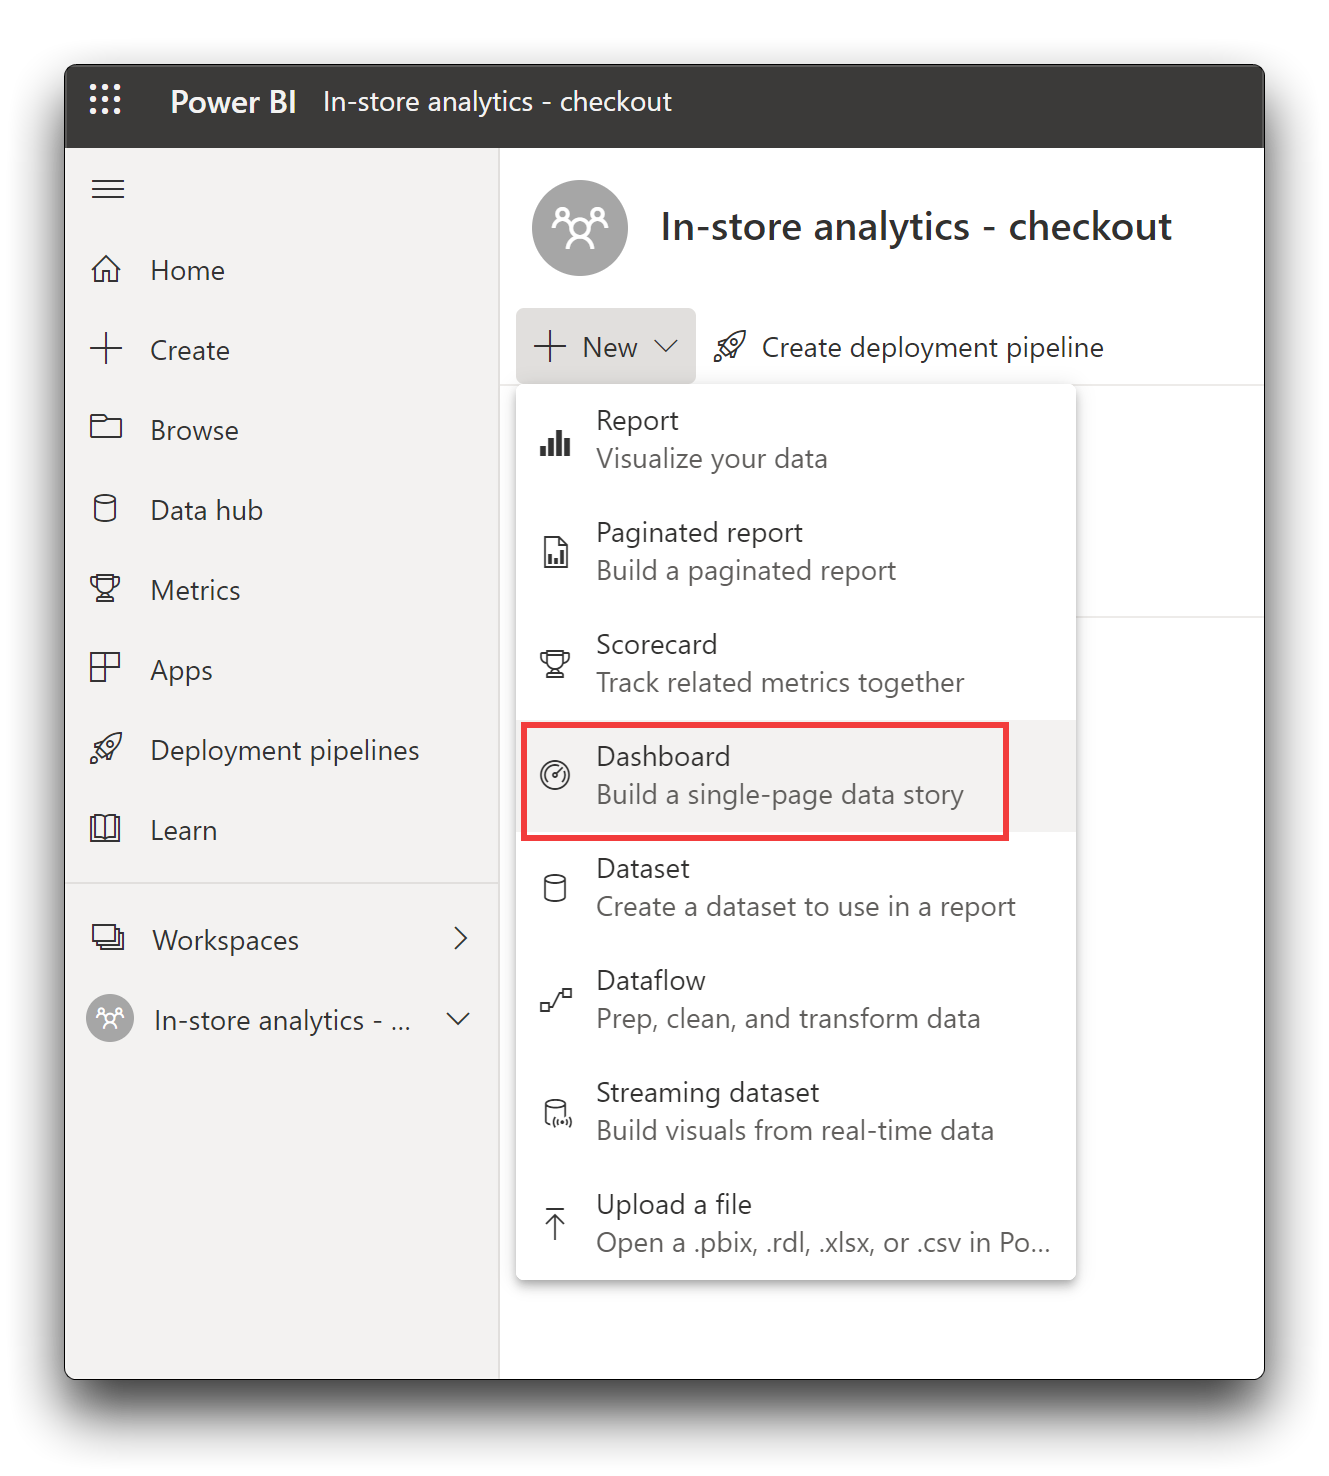
**Step 3.** Select **+ New** > **Dashboard**.
Enter **Store analytics** as the dashboard name, and select **Create**.
### Add line charts
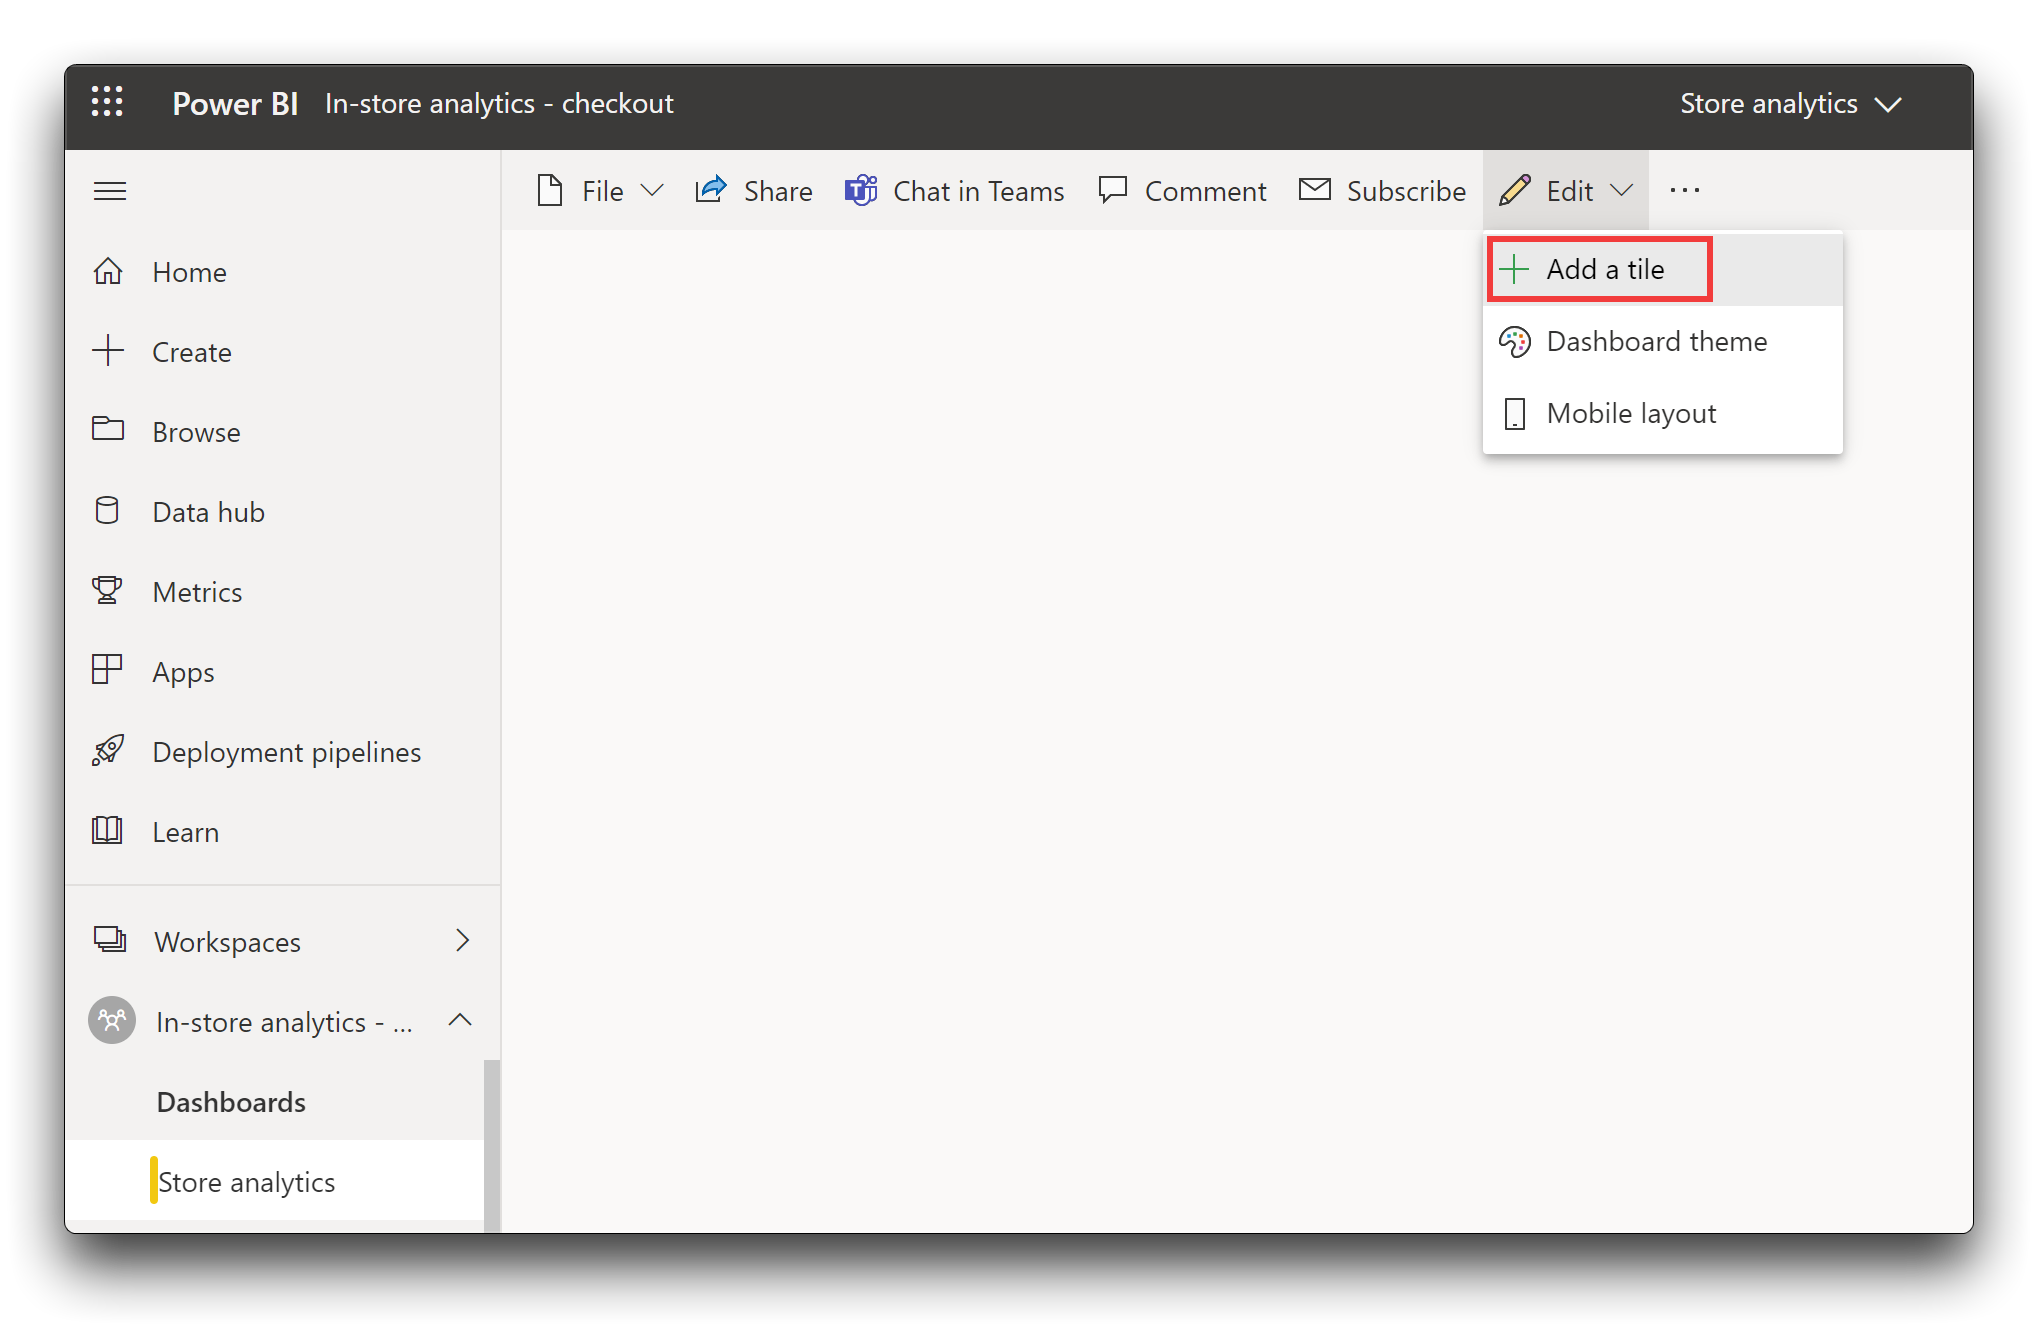
Add a line chart tiles to show the Tri-axis from the Wio Terminal buit-in sensors. Use the information in the following table to create the tiles. To add each tile, start by selecting **Edit** > **Add a tile**.
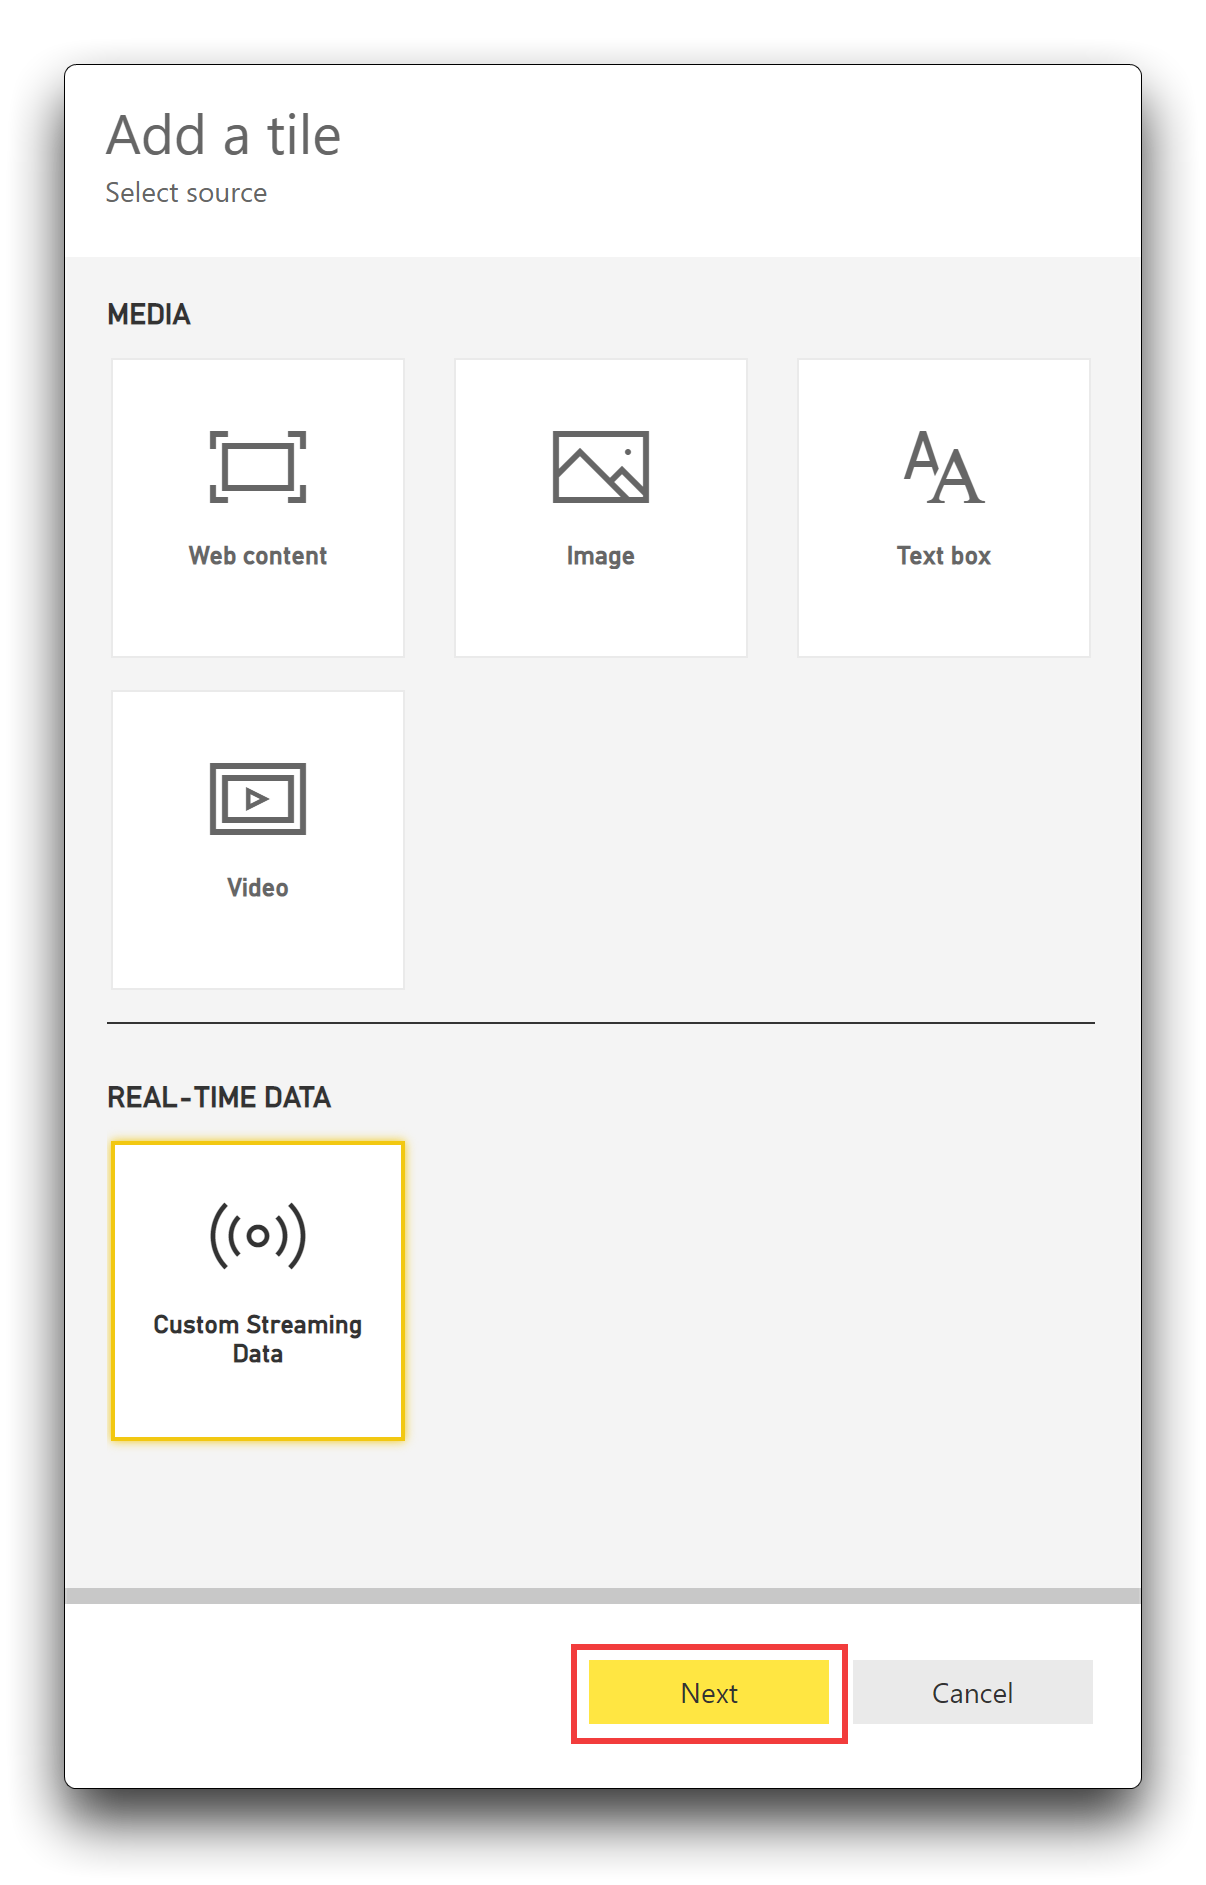
Select **Custom Streaming Data**, and then select **Next**.
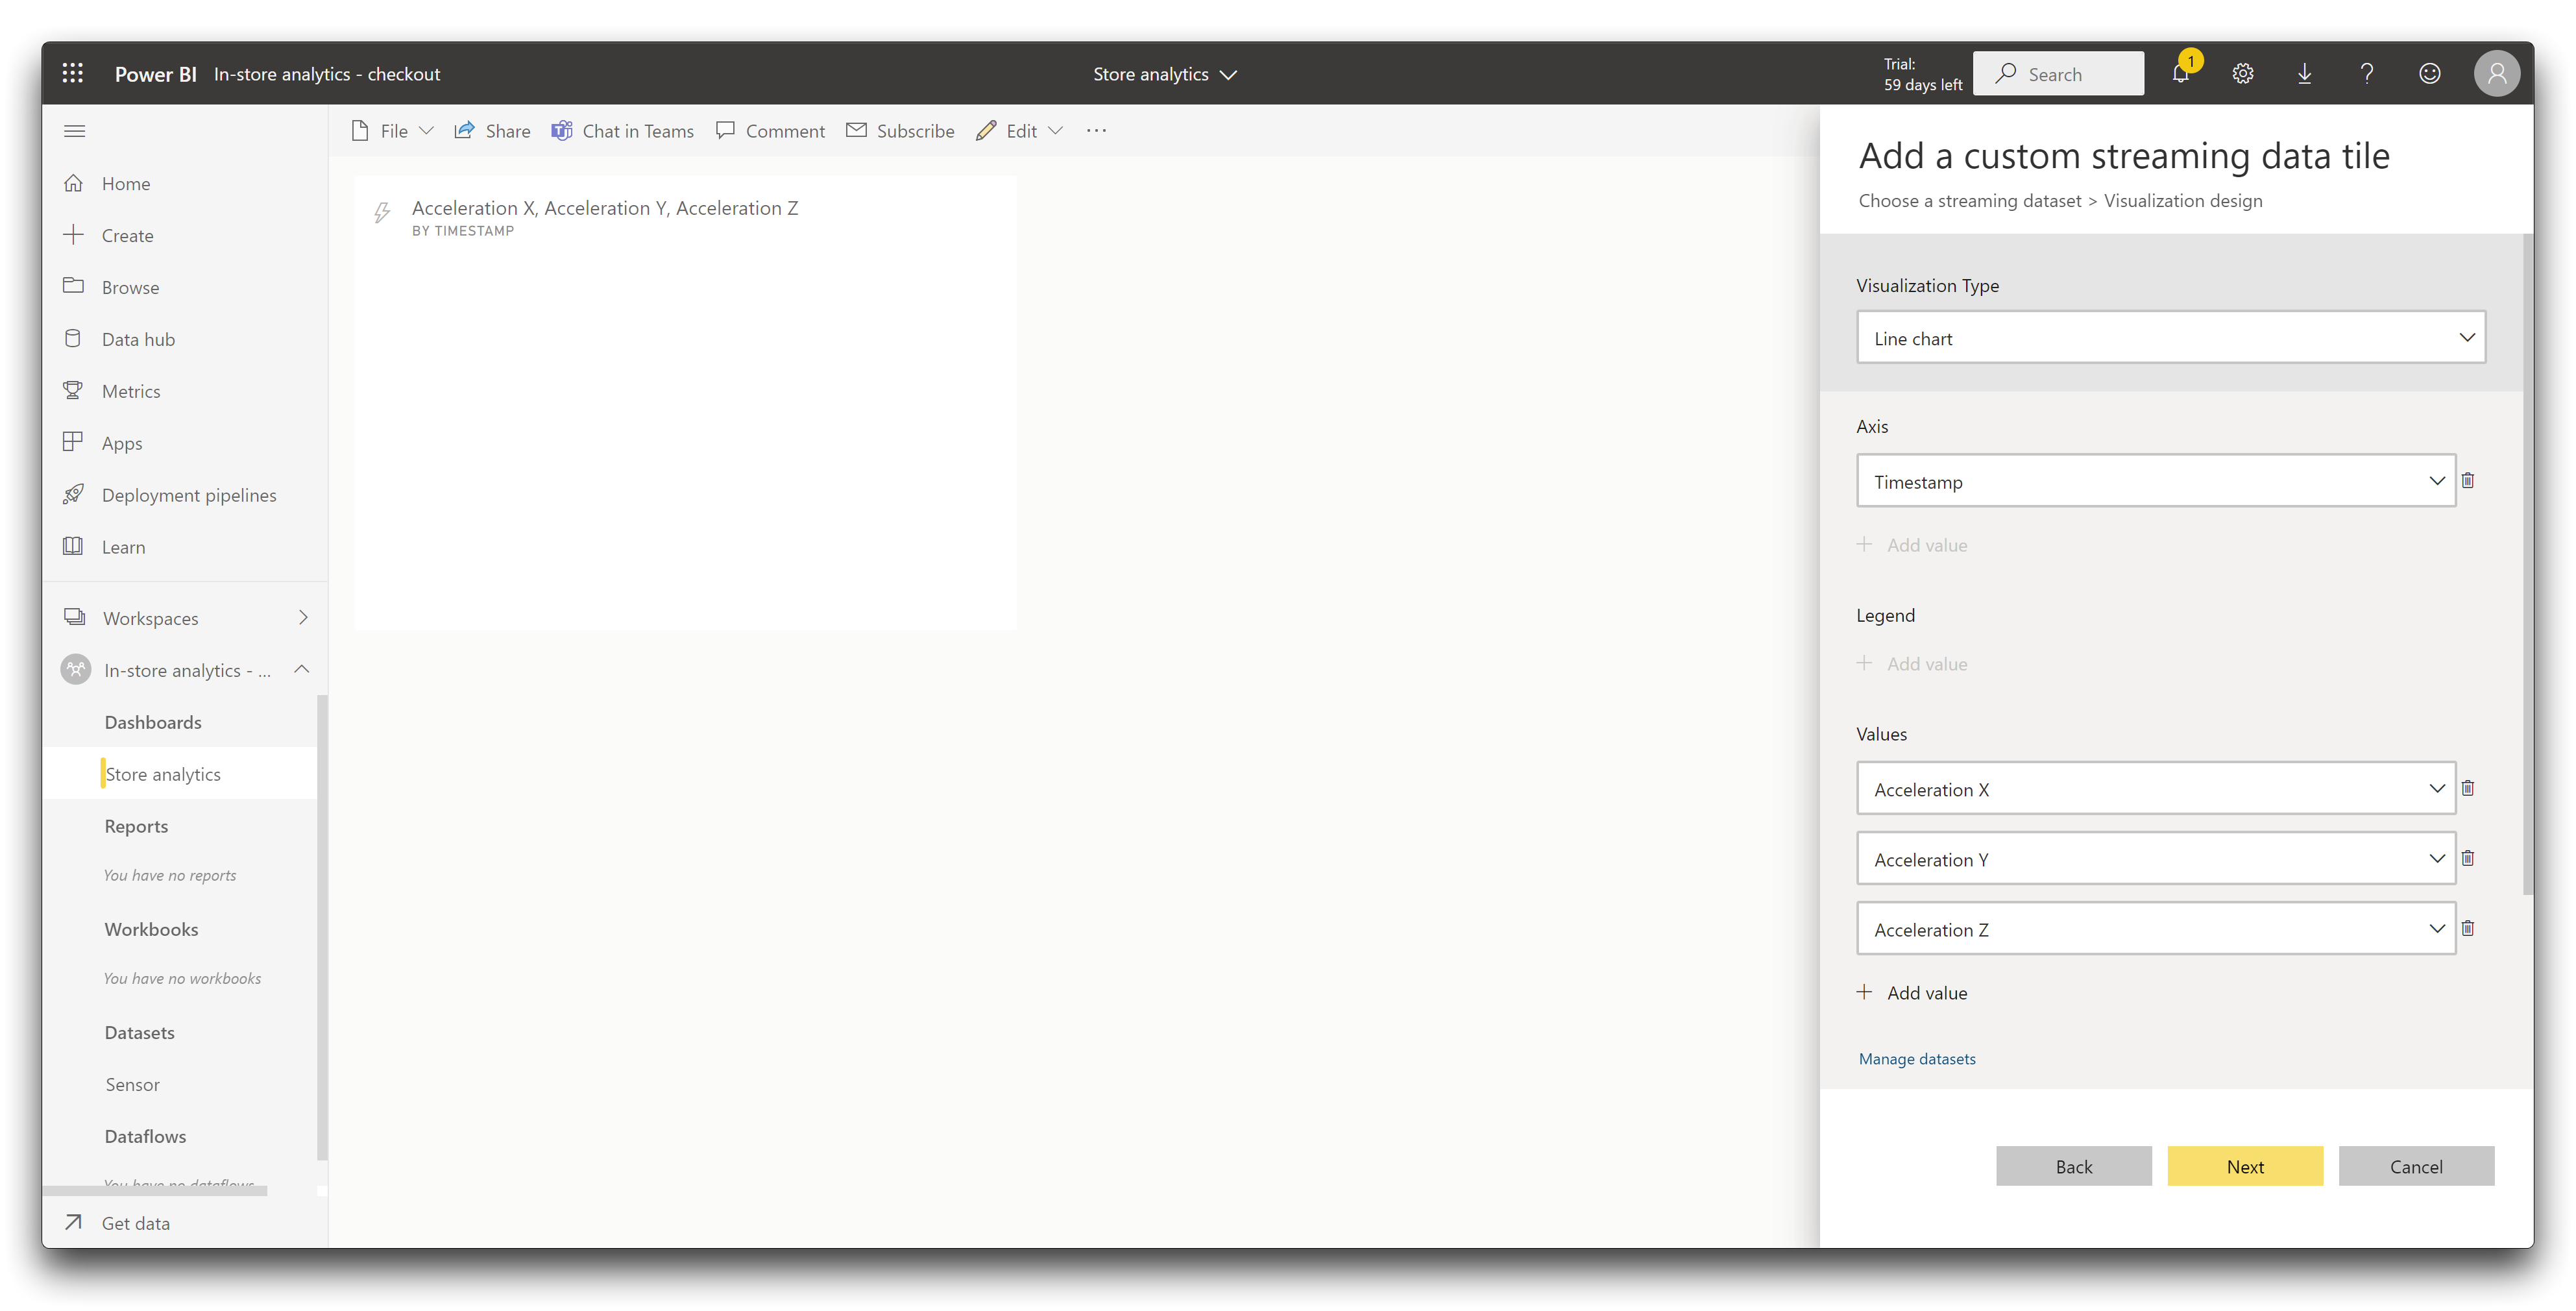
Configure the horizontal coordinate to display the timestamp and the vertical coordinate to display the data values on the X, Y and Z axes.
When the data stream starts to transfer, you will be able to see the dashboard as a line graph.
## Tech Support
Please do not hesitate to submit the issue into our [forum](https://forum.seeedstudio.com/).
> **Upgradable to Industrial Sensors**
SenseCAP K1100 serves as a gateway to the higher-end SenseCAP LoRaWAN® series of industrial outdoor sensors. Users can prototype multiple AIoT applications with this kit, after which they can scale them up to the robust, long-life, and industrial SenseCAP sensors.