# Connecting SenseCAP to Power BI via Node-RED **SenseCAP K1100 - The Sensor Prototype Kit** represents Seeed Studio concentrating the essence of LoRa® communication on technology and edge intelligence products, for the easiest deploying and mastering of LoRa® and IoT applications.

## Power BI Connect and analyze your entire data estate by combining Power BI with Azure analytics services—including Azure Synapse Analytics and Azure Data Lake Storage. Analyze petabytes of data, use advanced AI capabilities, apply additional data protection, and more easily share insights across your organization. In this tutorial we will guide you through how to import sensor data from **SenseCAP** into **Power BI** for more in-depth data processing by using Node RED.
## Preliminary preparation To complete this tutorial, you need: - If you haven't installed or don't know what Node-RED is, please refer to [Node-RED & SenseCAP Tutorials](https://wiki.seeedstudio.com/K1100_sensecap_node-red/). - A Power BI account. If you don't have a Power BI account, sign up for a [free Power BI Pro trial](https://app.powerbi.com/signupredirect?pbi_source=web) before you begin. - In any of the following wikis, you have successfully uploaded data to SenseCAP. - [Send sensor data to SenseCAP via LoRa®](https://wiki.seeedstudio.com/K1100-quickstart/#send-sensor-data-to-sensecap-via-lora) ## Create MQTT Node **Step 1.** Start Node-RED Start Node-RED by typing the command `node-red` in the terminal and open a browser and enter the address **http://localhost:1880** in the address bar to access the editor of Node-RED. **Step 2.** Create MQTT Node We use **Network -> mqtt in** node and configure mqtt in the format of the SenseCAP API as requested in the [previous tutorial](https://wiki.seeedstudio.com/K1100_sensecap_node-red/#mqtt-node). - Server: openstream.api.sensecap.seeed.cc - Port: 1883 - Protocol: MQTT V3.1.1 - Client ID: The format is `org--` - `` Your organization ID. We have obtained it in the [Get the SenseCAP API](#jump1). - `` uses your own randomly generated numbers or lowercase letters. - Topic Format: `/device_sensor_data/////`
OrgID Your organization ID. We have obtained it in the Get the SenseCAP API.
DevEUI Unique identification of sensor devices. This information can be found on the sticker on the back of the Grove - Wio E5, as well as in the SenseCAP console device.
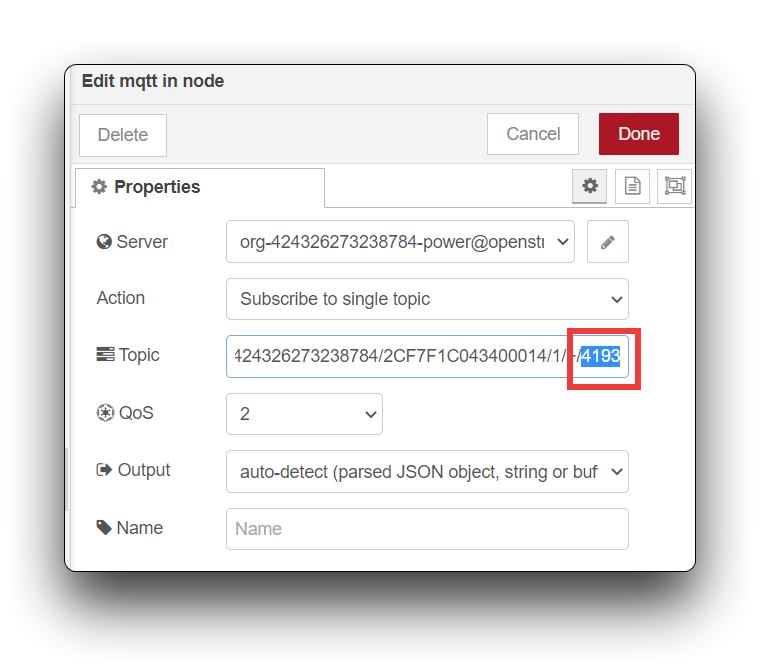
Channel A physical interface on the device to which the sensor is connected. For the K1100 kit, the default value here is 1.
Reserved Reserved Fields.
MeasurementID Measured value ID. This ID can be found in the Measurement IDs section of the SenseCAP documentation
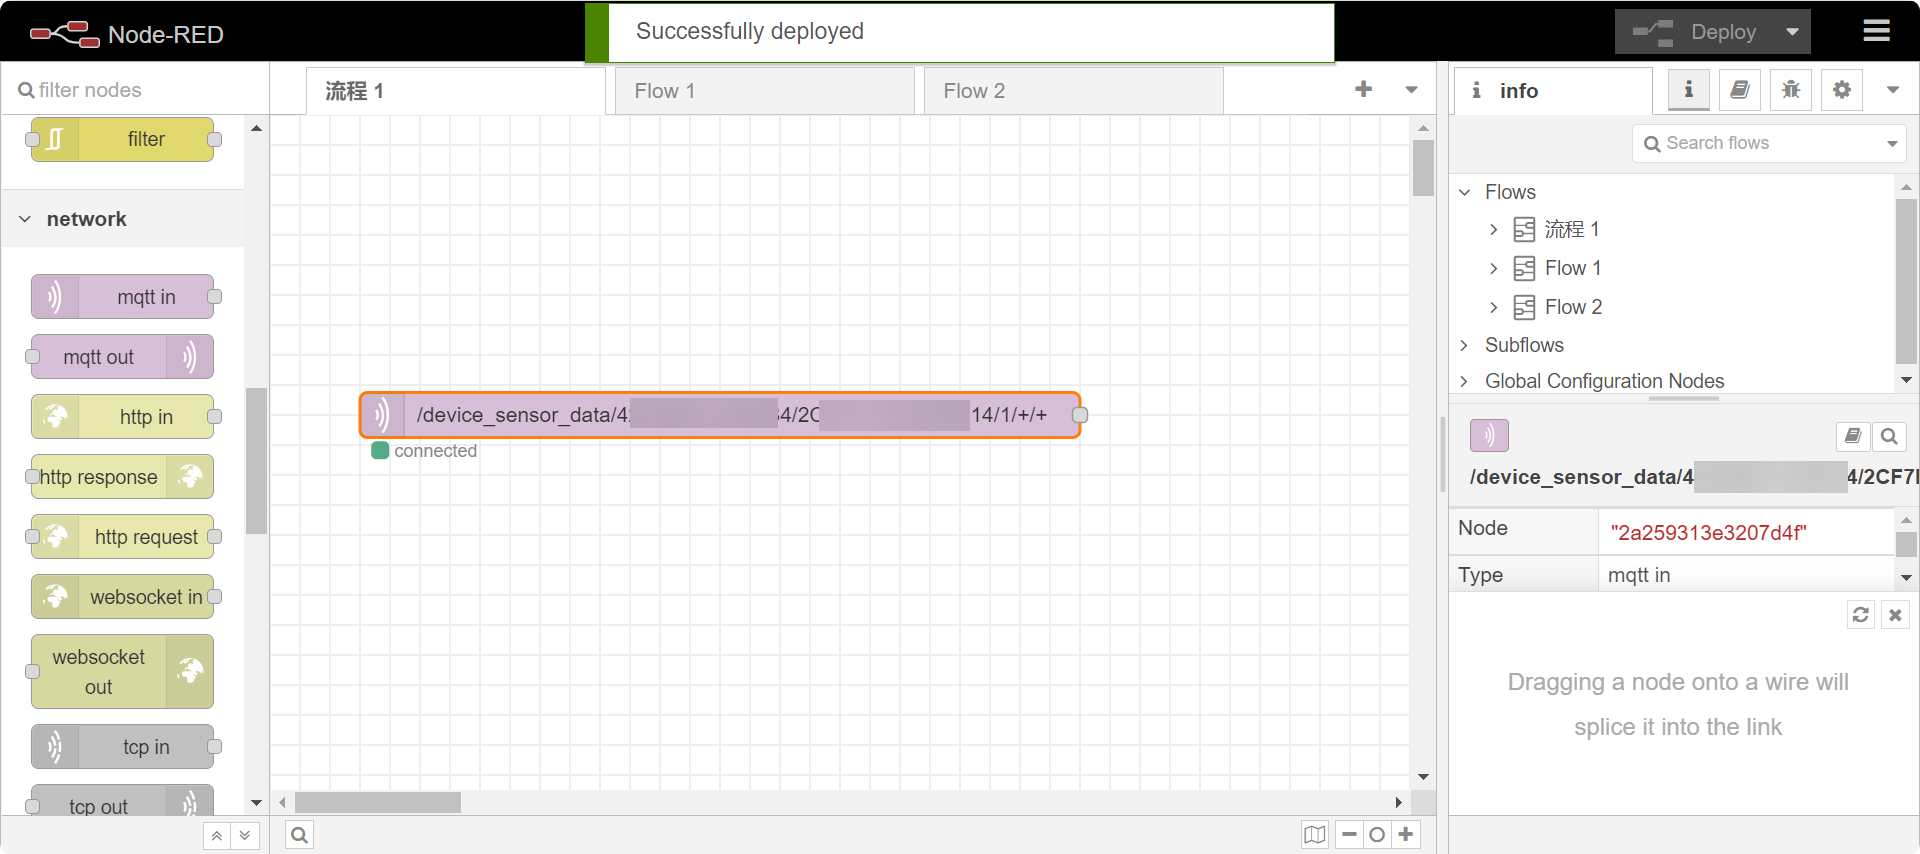
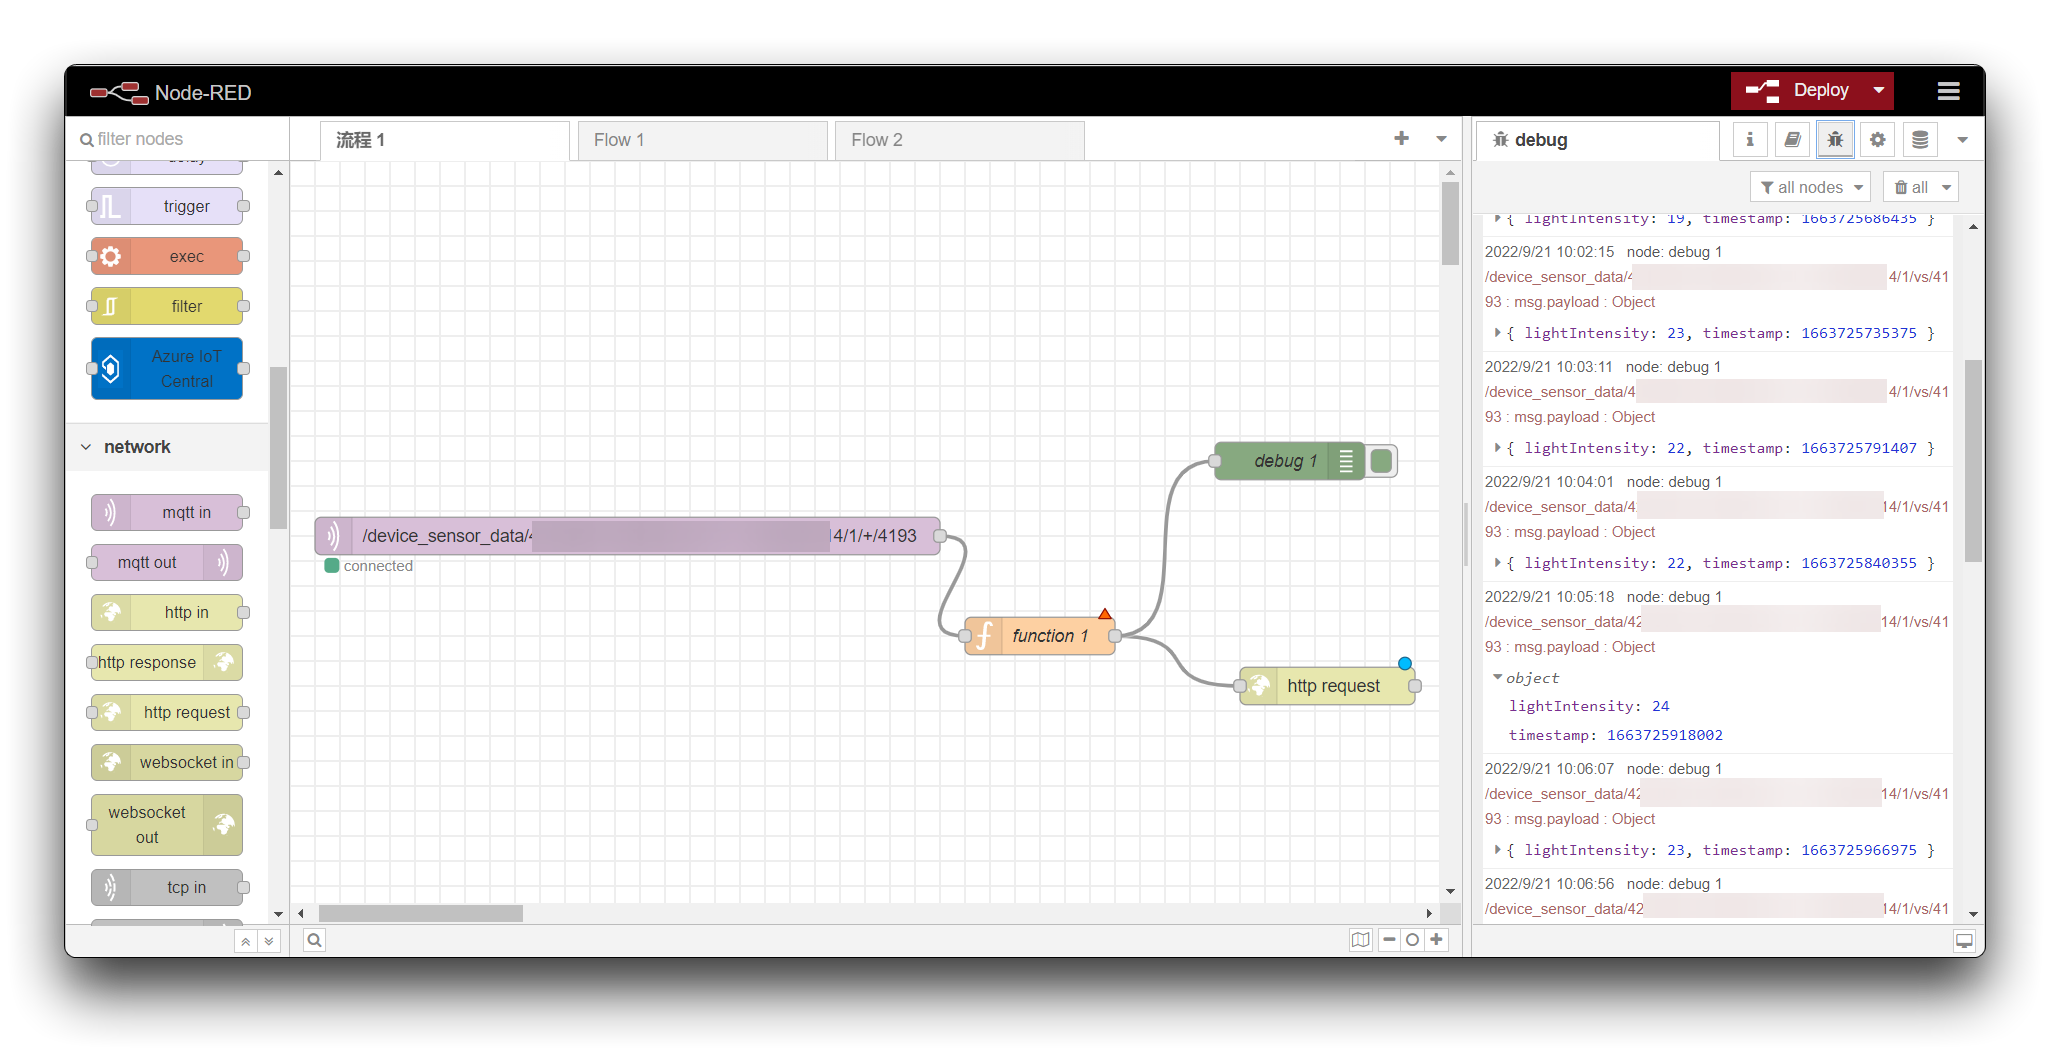
!!!Attention 
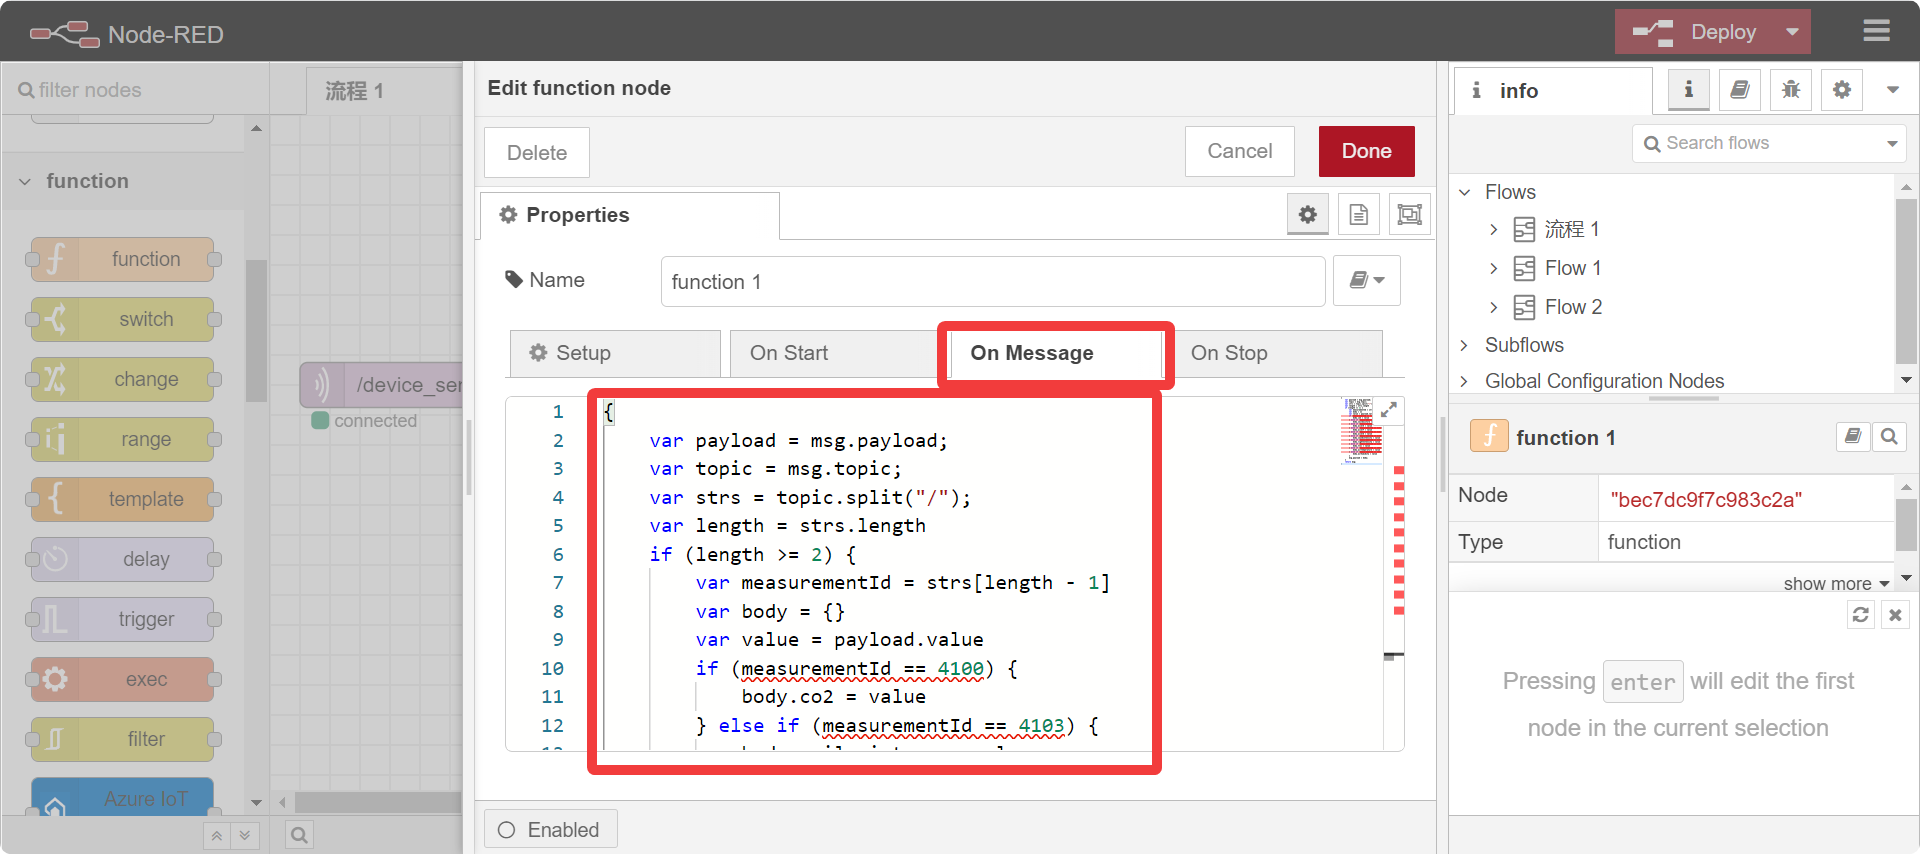
We recommend that an mqtt in node only transmits the values of a single sensor to avoid data confusion caused by transmitting the values of multiple sensors at the same time.
**Step 3.** Validate MQTT nodes Once configured, please click the **Deploy** button in the top right corner to check if the configuration was successful. If it is filled in correctly, then the word **Connected** will be displayed.
## Configure function node Data reporting to Power BI needs to follow a specific data format, so it's necessary to add a function node to process the data format.
Drag out the function node from the function bar on the left, double-click it to enter the edit page, then copy the code to On Message.
```javascript { var payload = msg.payload; var topic = msg.topic; var strs = topic.split("/"); var length = strs.length if (length >= 2) { var measurementId = strs[length - 1] var body = {} var value = payload.value if (measurementId == 4100) { body.co2 = value body.timestamp = msg.payload.timestamp } else if (measurementId == 4103) { body.soilmoisture = value body.timestamp = msg.payload.timestamp } else if (measurementId == 4150) { body.accelX = value body.timestamp = msg.payload.timestamp } else if (measurementId == 4151) { body.accelY = value body.timestamp = msg.payload.timestamp } else if (measurementId == 4152) { body.accelZ = value body.timestamp = msg.payload.timestamp } else if (measurementId == 4192) { body.soundintensity = value body.timestamp = msg.payload.timestamp } else if (measurementId == 4193) { body.lightIntensity = value body.timestamp = msg.payload.timestamp } else if (measurementId == 4195) { body.tvoc = value body.timestamp = msg.payload.timestamp } else if (measurementId == 4097) { body.airtemperature = value body.timestamp = msg.payload.timestamp } else if (measurementId == 4098) { body.airhumidity = value body.timestamp = msg.payload.timestamp } else if (measurementId == 4175) { body.AIdetection_1 = value body.timestamp = msg.payload.timestamp } else if (measurementId == 4176) { body.AIdetection_2 = value body.timestamp = msg.payload.timestamp } else if (measurementId == 4177) { body.AIdetection_3 = value body.timestamp = msg.payload.timestamp } else if (measurementId == 4178) { body.AIdetection_4 = value body.timestamp = msg.payload.timestamp } else if (measurementId == 4179) { body.AIdetection_5 = value body.timestamp = msg.payload.timestamp } else if (measurementId == 4180) { body.AIdetection_6 = value body.timestamp = msg.payload.timestamp } else if (measurementId == 4181) { body.AIdetection_7 = value body.timestamp = msg.payload.timestamp } else if (measurementId == 4182) { body.AIdetection_8 = value body.timestamp = msg.payload.timestamp } else if (measurementId == 4183) { body.AIdetection_9 = value body.timestamp = msg.payload.timestamp } else if (measurementId == 4184) { body.AIdetection_10 = value body.timestamp = msg.payload.timestamp } msg.payload = body; } return msg; } ``` !!!Tip The above code is common to all sensors and you can choose to paste it all into a function node or intercept a section of one of the sensors you are using to use. It is worth noting that the name of the sensor in the program needs to match the name set later in Power BI for the data stream to be transferred successfully. For example, in the above program the light sensor has the value name: **lightIntensity**. ## Create the Power BI datasets **Step 1.** Sign in to your [Power BI account](https://app.powerbi.com/). **Step 2.** Create a workspace. Select **Workspaces**, and then select **Create a workspace**.
On the Create a workspace page, enter **In-store analytics - checkout** as the Workspace name. Select **Save**.
**Step 3.** Create a streaming dataset. On the workspace page, select **+ New** > **Streaming dataset**.
On the New streaming dataset page, choose API, and then select Next.
Enter **Light-Sensor** as the Dataset name. Enter the Light values from stream in following table: | Value name | Value type | |---------------------------|------------------------------| | Timestamp | DataTime | | lightIntensity | Number | !!!Tip The Value name should be the same as the name of the function program in Node RED.
You now have a streaming datasets. Please make a note of the **Push URL** you get here, we will use it in the next step.
## Configure http request node Add **http request** from the storage bar on the left,double-click it to enter the configuration page, then click the edit button to edit **http request** node.
Please copy the URL obtained in the previous section into the URL in the http request page. Just change the method to **POST** and save it.
## Deploy and observe data **Step 1.** Deploy Then we connect all the nodes and click on the **Deploy** button and if everything is set up correctly you will be able to see the mqtt in node showing connected. If you want to see the logging information of the data, you can add a debug node after the function node.
Once the Wio Terminal starts powering up and working and starts sending data to SenseCAP PaaS server, then we can check the data on Node-RED debug log. **Step 2.** Configure Power BI dashboards Select **Workspaces** > **In-store analytics - checkout**. Select **+ New** > **Dashboard**.
Enter **Store analytics** as the dashboard name, and select **Create**. ### Add line charts Add a line chart tiles to show the Light value from the Wio Terminal buit-in sensors. Use the information in the following table to create the tiles. To add each tile, start by selecting **Edit** > **Add a tile**.
Select **Custom Streaming Data**, and then select **Next**.
Configure the horizontal coordinate to display the timestamp and the vertical coordinate to display the data values on the value.
When the data stream starts to transfer, you will be able to see the dashboard as a line graph. You can also add more graphics or data analysis to suit your needs.
## Tech Support Please do not hesitate to submit the issue into our [forum](https://forum.seeedstudio.com/). > **Upgradable to Industrial Sensors** SenseCAP K1100 serves as a gateway to the higher-end SenseCAP LoRaWAN® series of industrial outdoor sensors. Users can prototype multiple AIoT applications with this kit, after which they can scale them up to the robust, long-life, and industrial SenseCAP sensors.
## Statement - The LoRa® Mark is a trademark of Semtech Corporation or its subsidiaries. - LoRaWAN® is a mark used under license from the LoRa Alliance®.